-
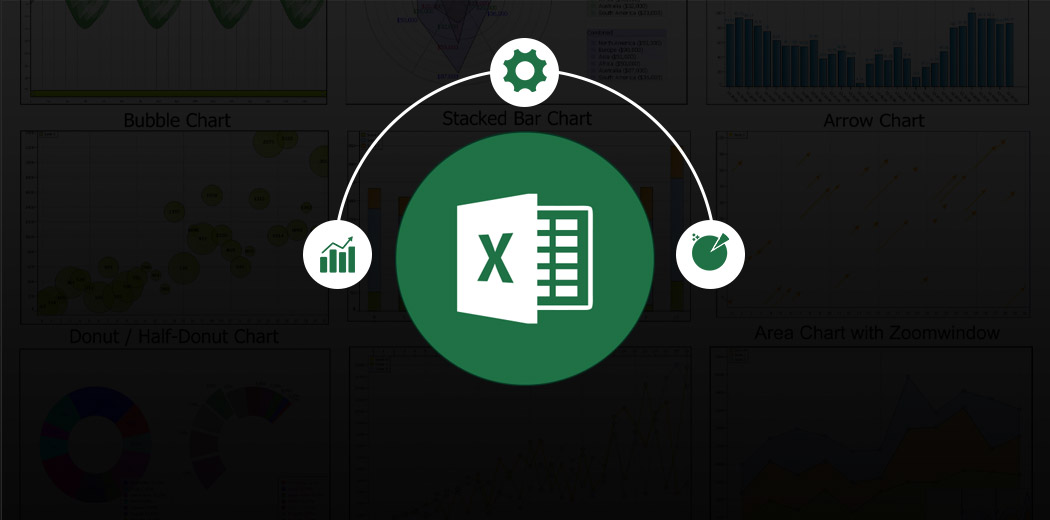
3 Ambitious Excel Charts to Boost your Analytics and Visualization ...
Excel charts enable analysts to create powerful and ambitious visualizations. Here are 3 such Excel charts for the analytics domain.
Ram Dewani 20 Jan, 2024
-
Predictive Modeling in Excel – How to Create a Linear Regress...
You can perform predictive modeling in Excel by following a few simple steps. Learn how to build a linear regression model in Excel here.
Ram Dewani 31 Jan, 2023
-
-
5 Powerful Excel Dashboards for Analytics Professionals
Excel dashboards are a powerful way of showcasing our data. Here are 5 powerful Excel dashboards to learn and use in your analytics career.
Ram Dewani 11 Jun, 2020
-
5 Useful Excel Tricks to Become an Efficient Analyst
Excel is an excellent tool for performing data cleaning and data preprocessing tasks. These 5 useful Excel tricks will make you efficient at data cleaning.
Ram Dewani 05 Jun, 2020
-
5 Excel Tricks You’ll Love Working with as an Analyst
These pivot tables tricks in Excel will make you a super efficient data analyst or business analyst. Learn how to analyze data using pivot tables.
Ram Dewani 28 May, 2020
-
5 Handy Excel Tricks for Conditional Formatting Every Analyst Shoul...
Conditional formatting is a handy feature in Microsoft Excel. Learn these 4 conditional formatting tricks and become a better analyst.
Ram Dewani 26 May, 2020
-
3 Classic Excel Tricks to Become an Efficient Analyst
Here are 3 classic Excel tricks to become an efficient analyst in your daily role. These tricks cover printing options, flashfill and heatmaps in Excel.
Ram Dewani 15 May, 2020
-
Business Analytics vs. Data Science – Which Path Should you C...
This article defines the difference between data science and business analytics and introduce an approach to select right career path for you.
Ram Dewani 10 May, 2020
-
7 Impressive Scikit-learn Hacks, Tips and Tricks for Data Science
scikit-learn, or sklearn, is a powerful machine learning library in Python. Master these sklearn tips, tricks and hacks to become a better data scientist.
Ram Dewani 07 May, 2020