Getting Started with Community Detection in Graphs and Networks
Introduction
The word “community” has entered mainstream conversations around the world this year thanks in no large part to the ongoing coronavirus pandemic. Given my experience and interest in graphs and graph theory in general, I wanted to understand and explore how I could leverage that in terms of a community.
That’s how I landed on the topic of community detection. While the current pandemic is beyond the scope of this article, I feel community detection is quite a nuanced topic everyone should at least know a bit about. This is an excellent extension of graph theory – the topic taking the data science community by storm there days.

My focus in this article is to help you get started with community detection. This will, of course, rely on an underlying understanding of graph theory as well (link to learn about it is provided below). We’ll talk about community detection in detail, including the Girvan-Newman algorithm and how to implement it in Python. There’s a lot to learn so let’s get the ball rolling!
This article, as you might have surmised already, assumes familiarity with graph theory. If you’re new to this topic, here’s a handy starting point:
Table of Contents
- What is a Community?
- What is Community Detection?
- Girvan-Newman Algorithm for Community Detection
- Understanding the Edge Betweenness Centrality
- Community Detection in Python (Implementation)
What is a Community?
Let’s first put a definition to the word “community”. It’s a broad term, right? We need to define what exactly it means in the context of this article.
A community, with respect to graphs, can be defined as a subset of nodes that are densely connected to each other and loosely connected to the nodes in the other communities in the same graph.
Let me break that down using an example. Think about social media platforms such as Facebook, Instagram, or Twitter, where we try to connect with other people. Eventually, after a while, we end up being connected with people belonging to different social circles. These social circles can be a group of relatives, school mates, colleagues, etc.
These social circles are nothing but communities!
What is Community Detection?
Detecting communities in a network is one of the most important tasks in network analysis. In a large scale network, such as an online social network, we could have millions of nodes and edges. Detecting communities in such networks becomes a herculean task.
Therefore, we need community detection algorithms that can partition the network into multiple communities.
There are primarily two types of methods for detecting communities in graphs:
- (a) Agglomerative Methods
- (b) Divisive Methods
(a) Agglomerative Methods
In agglomerative methods, we start with an empty graph that consists of nodes of the original graph but no edges. Next, the edges are added one-by-one to the graph, starting from “stronger” to “weaker” edges. This strength of the edge, or the weight of the edge, can be calculated in different ways.
Don’t worry – we will discuss this later. Keep in mind that new communities are formed in the consecutive steps of the algorithm.
(b) Divisive Methods
In divisive methods, we go the other way round. We start with the complete graph and take off the edges iteratively. The edge with the highest weight is removed first. At every step, the edge-weight calculation is repeated, since the weight of the remaining edges changes after an edge is removed. After a certain number of steps, we get clusters of densely connected nodes.
In this article, we will cover the Girvan-Newman algorithm – an example of the divisive method.
Girvan-Newman Algorithm for Community Detection
Under the Girvan-Newman algorithm, the communities in a graph are discovered by iteratively removing the edges of the graph, based on the edge betweenness centrality value.
The edge with the highest edge betweenness is removed first. We will cover this algorithm later in the article, but first, let’s understand the concept of “edge betweenness centrality”.
Edge Betweenness Centrality (EBC)
The edge betweenness centrality (EBC) can be defined as the number of shortest paths that pass through an edge in a network. Each and every edge is given an EBC score based on the shortest paths among all the nodes in the graph.
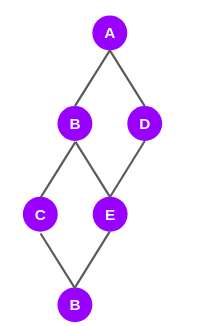
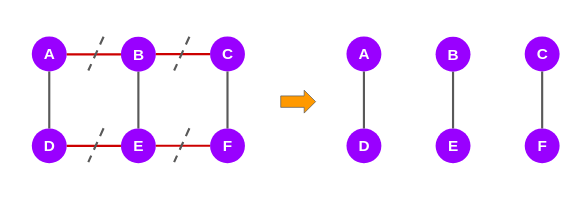
With respect to graphs and networks, the shortest path means the path between any two nodes covering the least amount of distance. Let’s take an example to find how EBC scores are calculated. Consider this graph below:
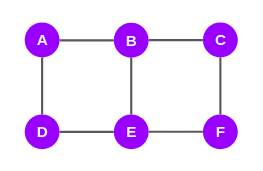
It has 6 nodes and 7 edges, right? Now, we will try to find the EBC scores for all the edges in this graph. Note that it is an iterative process and I’ve given an outline of it here:
- We will take one node at a time and plot the shortest paths to the other nodes from the selected node
- Based on the shortest paths, we will compute the EBC scores for all the edges
- We need to repeat this process for every node in the graph. As you can see, we have 6 nodes in the graph above. Therefore, there will be 6 iterations of this process
- This means every edge will get 6 scores. These scores will be added edge-wise
- Finally, the total score of each edge will be divided by 2 to get the EBC score
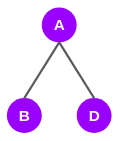
Now, let’s start with node A. The directly connected nodes to node A are nodes B and D. So, the shortest paths to B and D from A are AB and AD respectively:
It turns out that the shortest paths to nodes C and E from A go through B and D:
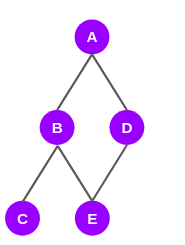
The shortest paths to the last node F from node A, pass through nodes B, D, C, and E:
The graph above depicts only the shortest paths from node A to all the other nodes. Now we will see how edges are scored.
Before giving scores to the edges, we will assign a score to the nodes in the shortest-path-graph. To assign these scores, we will have to traverse the graph from the root node, i.e., node A to the last node (node F).
Assigning Scores to Nodes

As you can see in the graph above, nodes B and D have been given a score of 1 each. This is because the shortest path to either node from node A is only one. For the very same reason, node C has been given a score of 1 as there is only one shortest path from node A to node C.
Moving on to node E. It is connected to node A through two shortest paths, ABE and ADE. Hence, it gets a score of 2.
The last node F is connected to A through three shortest paths — ABCF, ABEF, and ADEF. So, it gets a score of 3.
Computing Scores for Edges
Next, we will proceed with computing scores for the edges. Here we will move in the backward direction, from node F to node A:
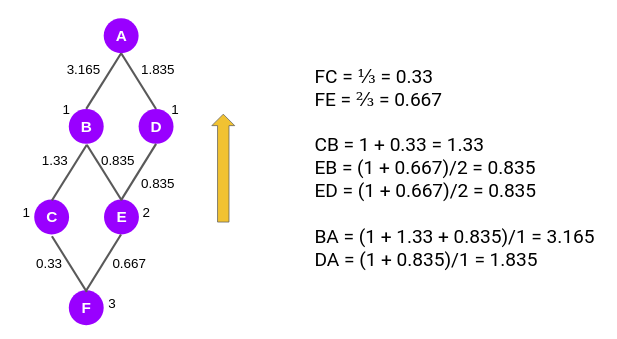
We first compute the score for the edges FC and FE. As you can see, the edge score for edge FC is the ratio of the node scores of C and F, i.e. 1/3 or 0.33. Similarly, for FE the edge score is 2/3.
Now we have to calculate the edge score for the edges CB, EB, and ED. According to the Girvan-Newman algorithm, from this level onwards, every node will have a default value of 1 and the edge scores computed in the previous step will be added to this value.
So, the edge score of CB is (1 + 0.33)/1. Similarly, edge score EB or ED is (1 + 0.667)/2. Then we move to the next level to calculate the edge scores for BA and DA.
So far, we have computed the edge scores of the shortest paths with respect to node A. We will have to repeat the same steps again from the other remaining five nodes. In the end, we will get a set of six scores for all the edges in the network. We will add these scores and assign them to the original graph as shown below:
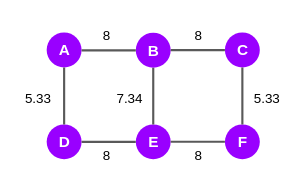
Since it is an undirected graph, we will divide these scores by two and finally, we will get the EBC scores:
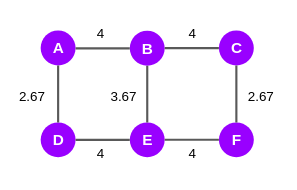
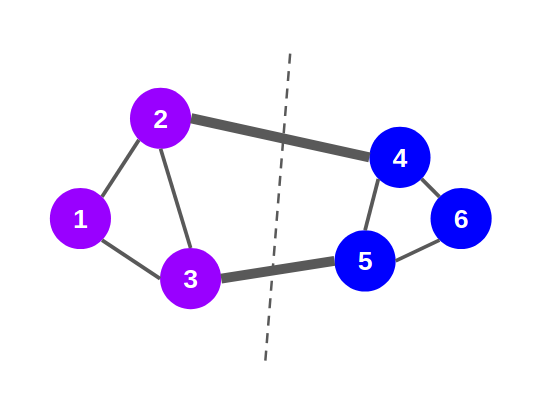
According to the Girvan-Newman algorithm, after computing the EBC scores, the edges with the highest scores will be taken off till the point the graph splits into two. So, in the graph above, we can see that the edges AB, BC, DE, and EF have the highest score, i.e., 4. We will strike off these edges and it gives us 3 subgraphs that we can call communities:
If you prefer learning all of this in video form, this will help you out:
Implementing the Girvan-Newman Algorithm for Community Detection in Python
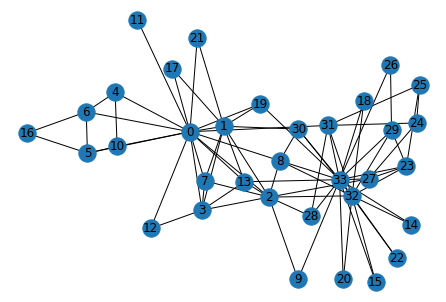
I will use Zachary’s karate club Graph to demonstrate how you can perform community detection using the Girvan-Newman Algorithm.
Zachary’s karate club is a social network of a university karate club. The network became a popular example of community structure in networks after its use by Michelle Girvan and Mark Newman in 2002.
We will start off with loading the required libraries: networkx and matplotlib:
The Karate Club graph comes pre-installed with the networkx library. So, we can easily import it:
len(G.nodes), len(G.edges)
Output: (34, 78)
It turns out that the graph has 34 nodes and 78 edges. This is a pretty small-sized graph. Usually, real-world graphs could easily be a thousand times bigger than this graph. But we’ll go ahead with this graph for the purpose of this tutorial.
Now, we know that in the Girvan-Newman method, the edges of the graph are eliminated one-by-one based on the EBC score. So, the first task is to find the EBC values for all the edges and then take off the edge with the largest value. The below function performs the exact task:
Now the function below will use the above function to partition the graph into multiple communities:
Next, let’s pass the Karate Club graph to the above function:
node_groups
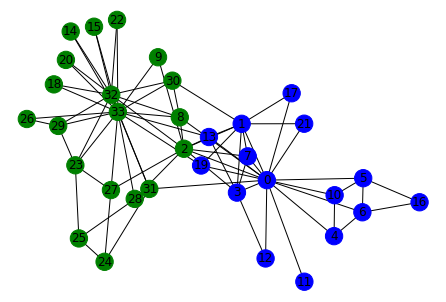
Output: [[0, 1, 3, 4, 5, 6, 7, 10, 11, 12, 13, 16, 17, 19, 21],
[32, 33, 2, 8, 9, 14, 15, 18, 20, 22, 23, 24, 25, 26, 27, 28, 29, 30, 31]]
These are the node sets belonging to two communities in the Karate Club graph according to the Girvan-Newman algorithm. Let’s use these node sets to visualize the communities discovered in the graph:


Extremely useful. Thanks