-
The Art of Storytelling in Analytics and Data Science | How to Crea...
This article lays out an approach to create stories based on data, visualizations and the best practices in storytelling in analytics and data science.
Karthe 08 May, 2020
-
A Comprehensive Learning Path to Understand and Master NLP in 2020
This NLP learning path is for everyone who wants to get started and master NLP. The learning path contains a multitude of NLP learning resources.
Karthe 14 Jun, 2020
-
2019 In-Review and Trends for 2020 – A Technical Overview of ...
Analytics Vidhya picks out its best highlights from 2019 in data science, machine learning and deep learning and provides its predictions for 2020!
Karthe 24 Dec, 2019
-
Heroes of Machine Learning – Top Experts and Researchers you ...
Check out these 23 heroes of machine learning by Analytics Vidhya! From Andrew Ng to Peter Norvig, these machine learning experts are a must know.
Karthe 19 Jul, 2019
-
6 Useful Programming Languages for Data Science You Should Learn (t...
Here are 6 best programming languages for data science that every data scientist should be aware of. This is the world beyond R and Python!
Karthe 14 Jun, 2020
-
Statistics for Data Science: Introduction to t-test and its Differe...
This tutorial dives into what a t-test is, the three different types of t-tests, and how to implement each t-test in R. Welcome to statistics 101.
Karthe 14 Jun, 2020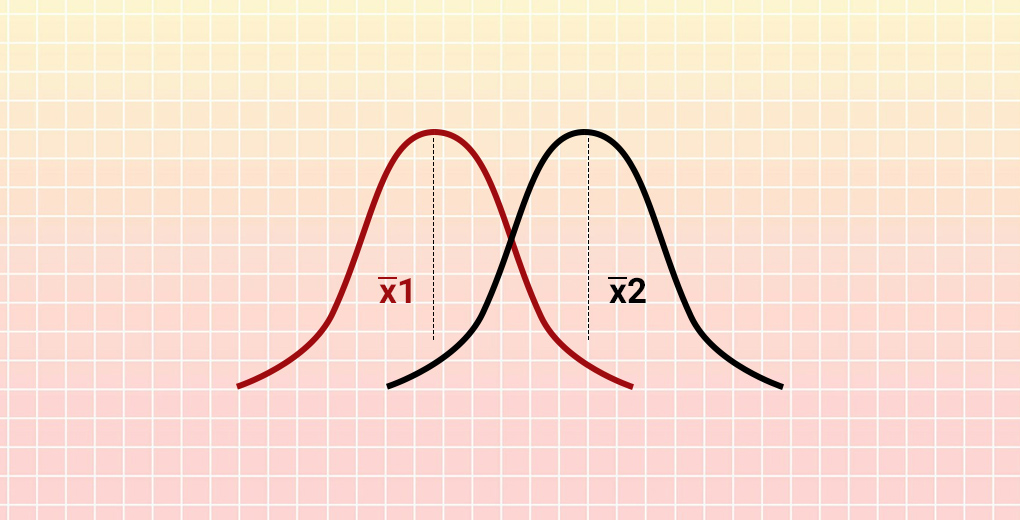
-
A Beginner’s Guide to Tidyverse – The Most Powerful Col...
Tidyverse is the most powerful collection of R packages. Learn about the tidyverse package in R and how each package works and get the full code here.
Karthe 14 Jun, 2020
-
Statistics for Data Science: Introduction to the Central Limit Theo...
What is the central limit theorem? What are it's applications? And how can you implement the central limit theorem in R? Find out in this article!
Karthe 14 Jun, 2020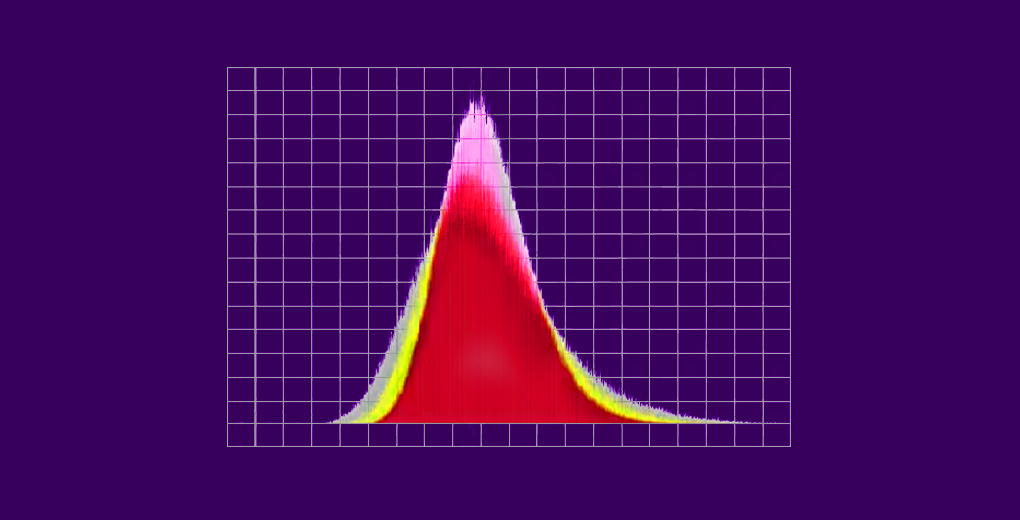
-
Winning Solutions and Approaches from the Machine Learning Hikeatho...
Check out the top 3 winning soltuions from the popular ML Hikeathon hosted by Analytics Vidhya and Hike!
Karthe 04 May, 2019
-
How I Built Animated Plots in R to Analyze my Fitness Data (and you...
In this article, I showcase how I used my fitness tracker data and created really cool interactive and animated plots in R.
Karthe 04 May, 2019