Statistics for Analytics and Data Science: Hypothesis Testing and Z-Test vs. T-Test
Overview
- Hypothesis testing is a key concept in statistics, analytics, and data science
- Learn how hypothesis testing works, the difference between Z-test and t-test, and other statistics concepts
Introduction
The coronavirus pandemic has made a statistician out of us all. We are constantly checking the numbers, making our own assumptions on how the pandemic will play out, and generating hypotheses on when the “peak” will happen. And it’s not just us performing hypothesis building – the media is thriving on it.
A few days back I was reading a news article that mentioned this outbreak “could potentially be seasonal” and relent in warmer conditions:

So I started wondering – what else can we hypothesize about the coronavirus? Are adults more likely to be affected by the outbreak of coronavirus? How does Relative Humidity impact the spread of the virus? What is the evidence to support these claims? How can we test these hypotheses?
As a Statistics enthusiast, all these questions dig up my old knowledge about the fundamentals of Hypothesis Testing. In this article, we will discuss the concept of Hypothesis Testing and the difference between the Z Test and t-Test. We will then conclude our Hypothesis Testing learning using a COVID-19 case study.
Are you new to the world of statistics and analytics? You should go through the below resources as well:
Table of Contents
- Fundamentals of Hypothesis Testing
- Basic Concepts – Null Hypothesis, Alternative Hypothesis, Type 1 Error, Type 2 Error, and Significance Level
- Steps to Perform Hypothesis Testing
- Directional Hypothesis
- Non Directional Hypothesis Test
- What is the Z Test?
- One-Sample Z Test
- Two Sample Z Test
- What is the t-Test?
- One-Sample t-Test
- Two-Sample t-Test
- Deciding between the Z Test and t-Test
- Case Study: Hypothesis Testing for Coronavirus in Python
Fundamentals of Hypothesis Testing

Let’s take an example to understand the concept of Hypothesis Testing. A person is on trial for a criminal offense and the judge needs to provide a verdict on his case. Now, there are four possible combinations in such a case:
- First Case: The person is innocent and the judge identifies the person as innocent
- Second Case: The person is innocent and the judge identifies the person as guilty
- Third Case: The person is guilty and the judge identifies the person as innocent
- Fourth Case: The person is guilty and the judge identifies the person as guilty
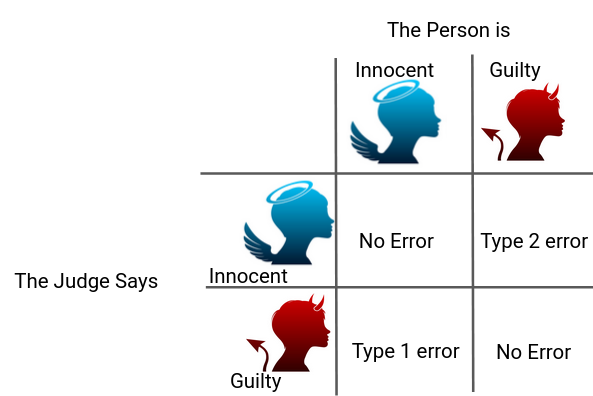
As you can clearly see, there can be two types of error in the judgment – Type 1 error, when the verdict is against the person while he was innocent and Type 2 error, when the verdict is in favor of Person while he was guilty
According to the Presumption of Innocence, the person is considered innocent until proven guilty. That means the judge must find the evidence which convinces him “beyond a reasonable doubt”. This phenomenon of “Beyond a reasonable doubt” can be understood as Probability (Judge Decided Guilty | Person is Innocent) should be small.
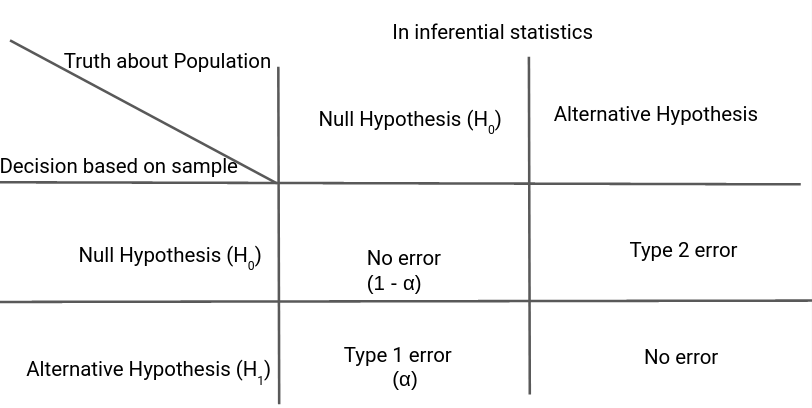
The basic concepts of Hypothesis Testing are actually quite analogous to this situation.
We consider the Null Hypothesis to be true until we find strong evidence against it. Then. we accept the Alternate Hypothesis. We also determine the Significance Level (⍺) which can be understood as the Probability of (Judge Decided Guilty | Person is Innocent) in the previous example. Thus, if ⍺ is smaller, it will require more evidence to reject the Null Hypothesis. Don’t worry, we’ll cover all of this using a case study later.
Steps to Perform Hypothesis testing
There are four steps to perform Hypothesis Testing:
- Set the Hypothesis
- Set the Significance Level, Criteria for a decision
- Compute the test statistics
- Make a decision
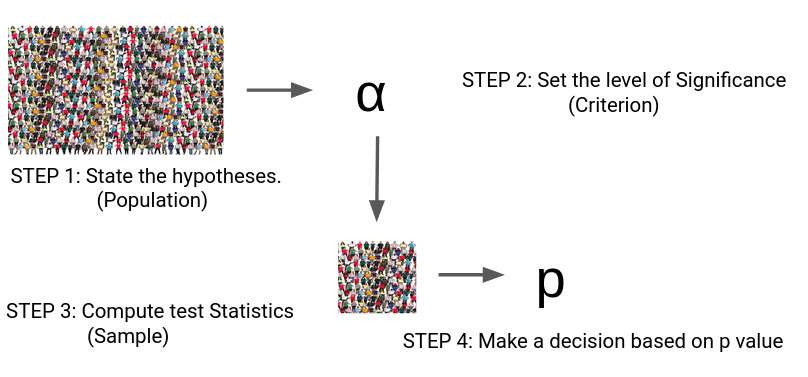
Steps 1 to 3 are quite self-explanatory but on what basis can we make a decision in step 4? What does this p-value indicate?
We can understand this p-value as the measurement of the Defense Attorney’s argument. If the p-value is less than ⍺ , we reject the Null Hypothesis or if the p-value is greater than ⍺, we fail to reject the Null Hypothesis.
Critical Value, p-value
Let’s understand the logic of Hypothesis Testing with the graphical representation for Normal Distribution.
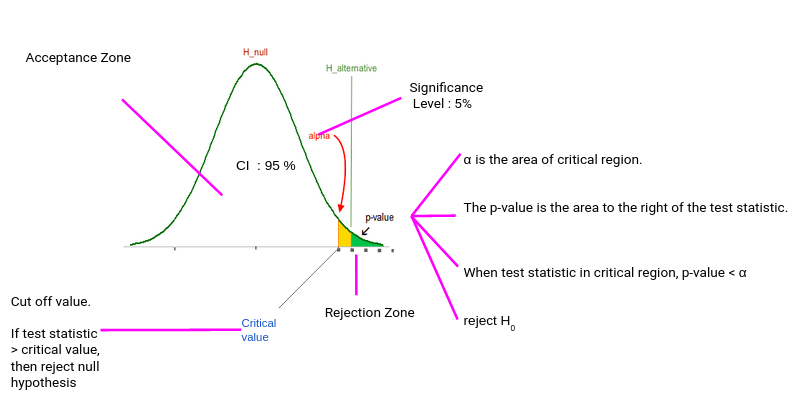
Typically, we set the Significance level at 10%, 5%, or 1%. If our test score lies in the Acceptance Zone we fail to reject the Null Hypothesis. If our test score lies in the critical zone, we reject the Null Hypothesis and accept the Alternate Hypothesis.
Critical Value is the cut off value between Acceptance Zone and Rejection Zone. We compare our test score to the critical value and if the test score is greater than the critical value, that means our test score lies in the Rejection Zone and we reject the Null Hypothesis. On the opposite side, if the test score is less than the Critical Value, that means the test score lies in the Acceptance Zone and we fail to reject the null Hypothesis.
But why do we need p-value when we can reject/accept hypotheses based on test scores and critical value?
p-value has the benefit that we only need one value to make a decision about the hypothesis. We don’t need to compute two different values like critical value and test scores. Another benefit of using p-value is that we can test at any desired level of significance by comparing this directly with the significance level.

This way we don’t need to compute test scores and critical value for each significance level. We can get the p-value and directly compare it with the significance level.
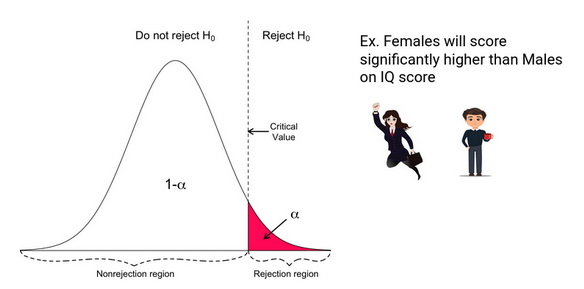
Directional Hypothesis
In the Directional Hypothesis, the null hypothesis is rejected if the test score is too large (for right-tailed and too small for left tailed). Thus, the rejection region for such a test consists of one part, which is right from the center.
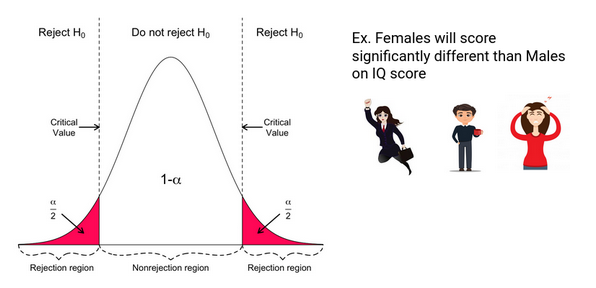
Non-Directional Hypothesis
In a Non-Directional Hypothesis test, the Null Hypothesis is rejected if the test score is either too small or too large. Thus, the rejection region for such a test consists of two parts: one on the left and one on the right.
What is the Z Test?
z tests are a statistical way of testing a hypothesis when either:
- We know the population variance, or
- We do not know the population variance but our sample size is large n ≥ 30
If we have a sample size of less than 30 and do not know the population variance, then we must use a t-test.
One-Sample Z test
We perform the One-Sample Z test when we want to compare a sample mean with the population mean.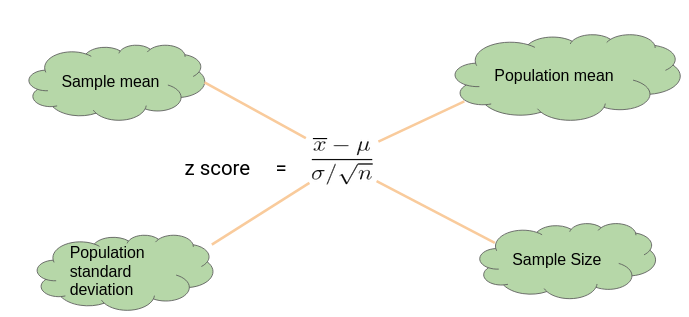
Here’s an Example to Understand a One Sample Z Test
Let’s say we need to determine if girls on average score higher than 600 in the exam. We have the information that the standard deviation for girls’ scores is 100. So, we collect the data of 20 girls by using random samples and record their marks. Finally, we also set our ⍺ value (significance level) to be 0.05.
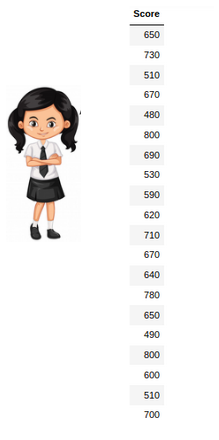
In this example:
- Mean Score for Girls is 641
- The size of the sample is 20
- The population mean is 600
- Standard Deviation for Population is 100
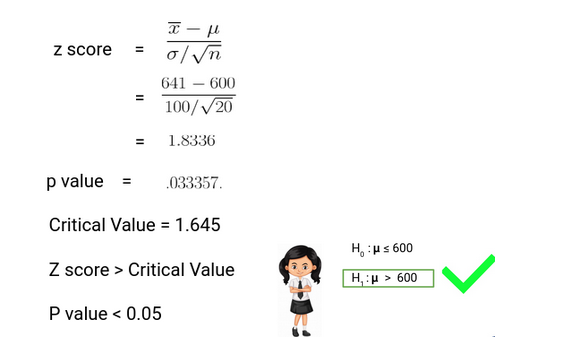
Since the P-value is less than 0.05, we can reject the null hypothesis and conclude based on our result that Girls on average scored higher than 600.
Two Sample Z Test
We perform a Two Sample Z test when we want to compare the mean of two samples.
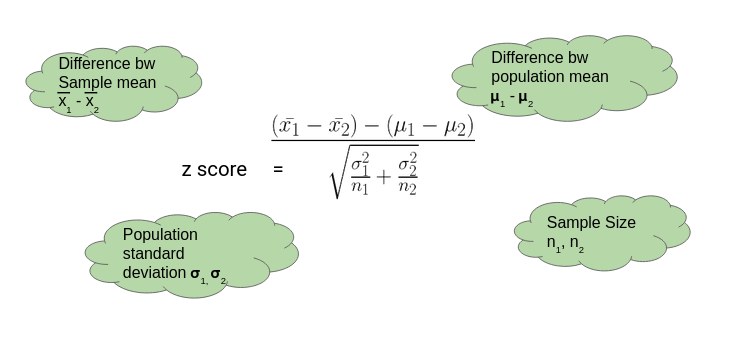
Here’s an Example to Understand a Two Sample Z Test
Here, let’s say we want to know if Girls on average score 10 marks more than the boys. We have the information that the standard deviation for girls’ Score is 100 and for boys’ score is 90. Then we collect the data of 20 girls and 20 boys by using random samples and record their marks. Finally, we also set our ⍺ value (significance level) to be 0.05.
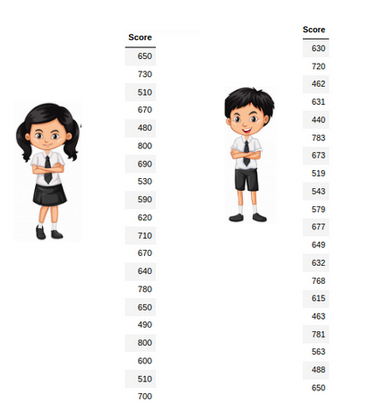
In this example:
- Mean Score for Girls (Sample Mean) is 641
- Mean Score for Boys (Sample Mean) is 613.3
- Standard Deviation for the Population of Girls’ is 100
- Standard deviation for the Population of Boys’ is 90
- Sample Size is 20 for both Girls and Boys
- Difference between Mean of Population is 10
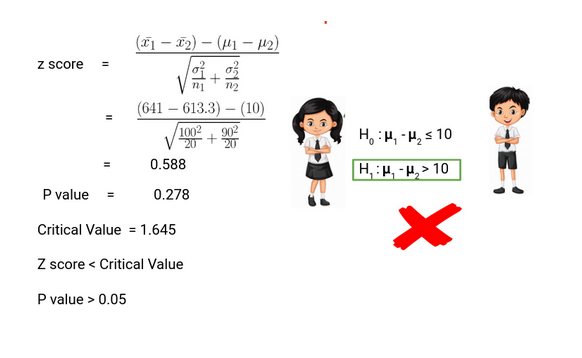
Thus, we can conclude based on the P-value that we fail to reject the Null Hypothesis. We don’t have enough evidence to conclude that girls on average score of 10 marks more than the boys. Pretty simple, right?
What is the t-Test?
t-tests are a statistical way of testing a hypothesis when:
- We do not know the population variance
- Our sample size is small, n < 30
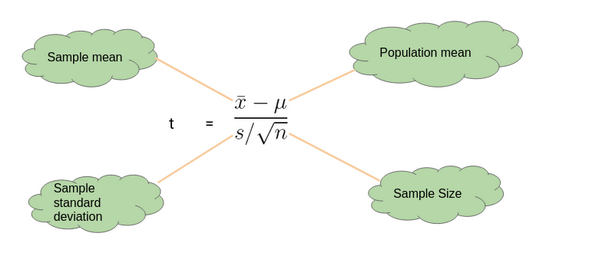
One-Sample t-Test
We perform a One-Sample t-test when we want to compare a sample mean with the population mean. The difference from the Z Test is that we do not have the information on Population Variance here. We use the sample standard deviation instead of population standard deviation in this case.
Here’s an Example to Understand a One Sample t-Test
Let’s say we want to determine if on average girls score more than 600 in the exam. We do not have the information related to variance (or standard deviation) for girls’ scores. To a perform t-test, we randomly collect the data of 10 girls with their marks and choose our ⍺ value (significance level) to be 0.05 for Hypothesis Testing.

In this example:
- Mean Score for Girls is 606.8
- The size of the sample is 10
- The population mean is 600
- Standard Deviation for the sample is 13.14
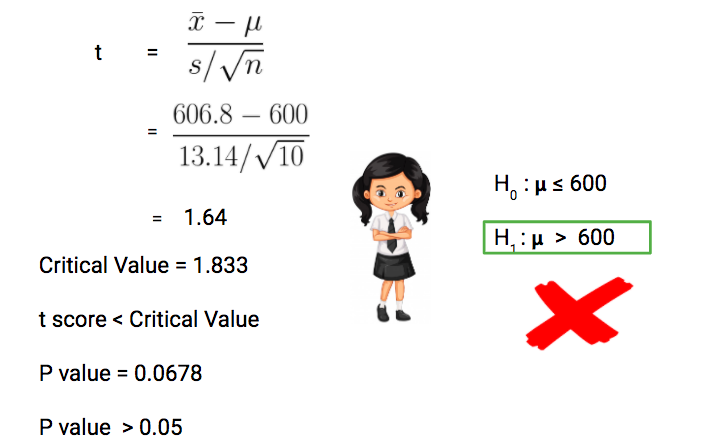
Our P-value is greater than 0.05 thus we fail to reject the null hypothesis and don’t have enough evidence to support the hypothesis that on average, girls score more than 600 in the exam.
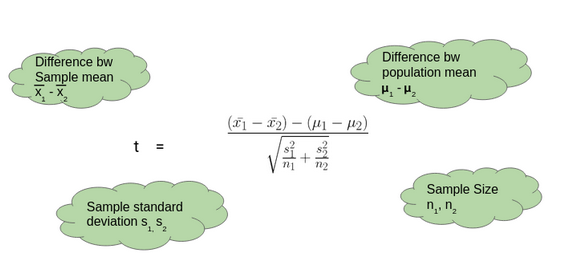
Two-Sample t-Test
We perform a Two-Sample t-test when we want to compare the mean of two samples.
Here’s an Example to Understand a Two-Sample t-Test
Here, let’s say we want to determine if on average, boys score 15 marks more than girls in the exam. We do not have the information related to variance (or standard deviation) for girls’ scores or boys’ scores. To perform a t-test. we randomly collect the data of 10 girls and boys with their marks. We choose our ⍺ value (significance level) to be 0.05 as the criteria for Hypothesis Testing.

In this example:
- Mean Score for Boys is 630.1
- Mean Score for Girls is 606.8
- Difference between Population Mean 15
- Standard Deviation for Boys’ score is 13.42
- Standard Deviation for Girls’ score is 13.14
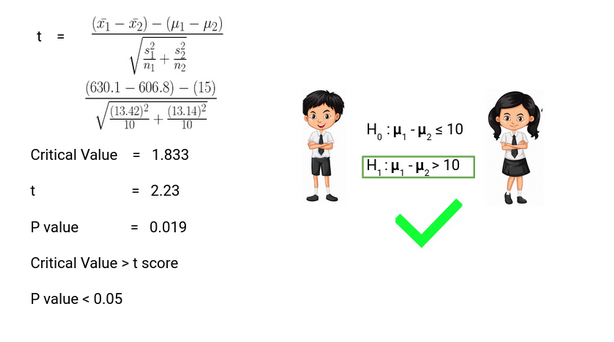
Thus, P-value is less than 0.05 so we can reject the null hypothesis and conclude that on average boys score 15 marks more than girls in the exam.
Deciding between Z Test and T-Test
So when we should perform the Z test and when we should perform t-Test? It’s a key question we need to answer if we want to master statistics.
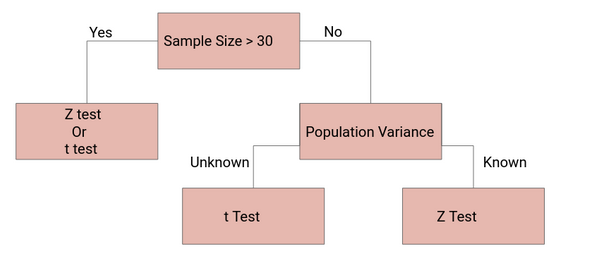
If the sample size is large enough, then the Z test and t-Test will conclude with the same results. For a large sample size, Sample Variance will be a better estimate of Population variance so even if population variance is unknown, we can use the Z test using sample variance.
Similarly, for a Large Sample, we have a high degree of freedom. And since t-distribution approaches the normal distribution, the difference between the z score and t score is negligible.
Case Study: Hypothesis Testing for Coronavirus using Python
Now let’s implement the Two-Sample Z test for a coronavirus dataset. Let’s put our theoretical knowledge into practice and see how well we can do. You can download the dataset here.
This dataset has been taken from John Hopkin’s repository and you can find the link here for it.
This dataset here the below features:
- Province/State
- Country/Region
- Last Update
- Confirmed
- Deaths
- Recovered
- Lattitude
- Longitude
And we have added the feature of Temperature and Humidity for Latitude and Longitude using Python’s Weather API – Pyweatherbit. A common perception about COVID-19 is that Warm Climate is more resistant to the corona outbreak and we need to verify this using Hypothesis Testing. So what will our null and alternate hypothesis be?
- Null Hypothesis: Temperature doesn’t affect COV-19 Outbreak
- Alternate Hypothesis: Temperature does affect COV-19 Outbreak
Note: We are considering Temperature below 24 as Cold Climate and above 24 as Hot Climate in our dataset.
import pandas as pd
import numpy as np
corona = pd.read_csv('Corona_Updated.csv')
corona['Temp_Cat'] = corona['Temprature'].apply(lambda x : 0 if x < 24 else 1)
corona_t = corona[['Confirmed', 'Temp_Cat']]
def TwoSampZ(X1, X2, sigma1, sigma2, N1, N2):
    from numpy import sqrt, abs, round
    from scipy.stats import norm
    ovr_sigma = sqrt(sigma1**2/N1 + sigma2**2/N2)
    z = (X1 - X2)/ovr_sigma
    pval = 2*(1 - norm.cdf(abs(z)))
    return z, pval
d1 = corona_t[(corona_t['Temp_Cat']==1)]['Confirmed']
d2 = corona_t[(corona_t['Temp_Cat']==0)]['Confirmed']

m1, m2 = d1.mean(), d2.mean()
sd1, sd2 = d1.std(), d2.std()
n1, n2 = d1.shape[0], d2.shape[0]

z, p = TwoSampZ(m1, m2, sd1, sd2, n1, n2)

z_score = np.round(z,8)
p_val = np.round(p,6)

if (p_val<0.05):
    Hypothesis_Status = 'Reject Null Hypothesis : Significant'
else:
    Hypothesis_Status = 'Do not reject Null Hypothesis : Not Significant'

print (p_val)
print (Hypothesis_Status)
Thus. we do not have evidence to reject our Null Hypothesis that temperature doesn’t affect the COV-19 outbreak. Although we cannot find the Temperature’s impact on COV-19, this problem has just been taken for the conceptual understanding of what we have learned in this article. There are certain limitations of the Z test for COVID-19 datasets:
- Sample data may not be well representative of population data
- Sample variance may not be a good estimator of the population variance
- Variability in a state’s capacity to deal with this pandemic
- Socio-Economic Reasons
- Early breakout in certain places
- Some states could be hiding the data for geopolitical reasons
So, we need to be more cautious and research more to identify the pattern of this pandemic.
End Notes
In this article, we followed a step by step procedure to understand the fundamentals of Hypothesis Testing, Type 1 Error, Type 2 Error, Significance Level, Critical Value, p-Value, Non-Directional Hypothesis, Directional Hypothesis, Z Test and t-Test and finally implemented Two Sample Z Test for a coronavirus case study.
For more details you can also read these articles:
Always remember – “Statistics is the Grammar of Data Science”. Did you find this article useful? Can you think of any other applications of different statistical tests? Let me know in the comments section below and we can come up with more ideas.


For the one-sample T-test, shouldn't critical value > t-score (1.833 > 1.64)?
Thank you for the nice article . clearly explained. One clarification please so the type 1error is not in favor of the person when is actually innocent ?
Thank you for the nice article . clearly explained. One clarification please so the type 1error is not in favor of the person when is actually innocent ?
Yes, Type 1 error is a rejection of Null Hypothesis even if it's true (verdict against the Person even if he is innocent) which is also the False Positive.
Hi Subhash, well written article! Thanks