Here’s How to Build a Pivot Table using Pandas in Python
Pivot tables – the Swiss Army Knife of data analysis
I love how quickly I can analyze data using pivot tables. With one click of my mouse, I can drill down into the granular details about a certain product category, or zoom out and get a high-level overview of the data at hand.
Pivot tables offer a ton of flexibility for me as a data scientist. I’ll be honest – I rely on them a lot during the exploratory data analysis phase in a data science project.
Excel users will be intimately familiar with these pivot tables. They’re the most used feature of Excel, and it’s easy to see why! But did you know that you can build these pivot tables using Pandas in Python?

That’s right! The wonderful Pandas library offers a function called pivot_table that summarized a feature’s values in a neat two-dimensional table. We’ll see how to build such a pivot table in Python here.
Trust me, you’ll be using these pivot tables in your own projects very soon! Please note that this tutorial assumes basic Pandas and Python knowledge. If you’re new to these topics, you can pick them up in the below free courses:
Table of Contents
- Exploring the Titanic Dataset with Pandas in Python
- Build a Pivot Table using Pandas
- How to group data using index in pivot table?
- How to run a pivot with a multi-index?
- Different aggregation function for different features
- Aggregate on specific features with values parameter
- Find the relationship between features with columns parameter
- Handling missing data
Exploring the Titanic Dataset using Pandas in Python
I’m sure you’ve come across the Titanic dataset in your data science journey. It’s among the first datasets we pick up when we’re ready to explore a project. I’ll be using that to show you the efficacy of the pivot_table function.
Let’s import the relevant libraries:
import pandas as pd
import numpy as np
import matplotlib.pyplot as plt
plt.style.use('ggplot')
df = pd.read_csv('drive/My Drive/AV/train.csv')
df.head()

I will be dropping a few features to make it easier to analyze the data and demonstrate the capabilities of the pivot_table function:
df.drop(['PassengerId','Ticket','Name'],inplace=True,axis=1)
Building a Pivot Table using Pandas
Time to build a pivot table in Python using the awesome Pandas library! We will explore the different facets of a pivot table in this article and build an awesome, flexible pivot table from scratch.
How to group data using index in a pivot table?
- pivot_table requires a data and an index parameter
- data is the Pandas dataframe you pass to the function
- index is the feature that allows you to group your data. The index feature will appear as an index in the resultant table
I will be using the ‘Sex’ column as the index for now:
#a single index
table = pd.pivot_table(data=df,index=['Sex'])
table

We can instantly compare all the feature values for both the genders. Now, let’s visualize the finding:
table.plot(kind='bar');

Well, the female passengers paid remarkably more for the tickets than the male passengers.
You can learn more about how to visualize your data here.
How to run a pivot with a multi-index?
You can even use more than one feature as an index to group your data. This increases the level of granularity in the resultant table and you can get more specific with your findings:
#multiple indexes
table = pd.pivot_table(df,index=['Sex','Pclass'])
table

Using multiple indexes on the dataset enables us to concur that the disparity in ticket fare for female and male passengers was valid across every Pclass on Titanic.
Different aggregation function for different features
The values shown in the table are the result of the summarization that aggfunc applies to the feature data. aggfunc is an aggregate function that pivot_table applies to your grouped data.
By default, it is np.mean(), but you can use different aggregate functions for different features too! Just provide a dictionary as an input to the aggfunc parameter with the feature name as the key and the corresponding aggregate function as the value.
I will be using np.mean() for the ‘Age’ feature and np.sum() for the ‘Survived’ feature:
#different aggregate functions
table = pd.pivot_table(df,index=['Sex','Pclass'],aggfunc={'Age':np.mean,'Survived':np.sum})
table

The resultant table makes more sense on using different aggregating functions for different features.
Aggregate on specific features with values parameter
But what are you aggregating on? You can tell Pandas the feature(s) to apply the aggregate function on, in the value parameter.
value parameter is where you tell the function which features to aggregate on. It is an optional field and if you don’t specify this value, then the function will aggregate on all the numerical features of the dataset:
table = pd.pivot_table(df,index=['Sex','Pclass'],values=['Survived'], aggfunc=np.mean)
table

table.plot(kind='bar');

The survival rate of passengers aboard the Titanic decreased with a degrading Pclass among both the genders. Moreover, the survival rate of male passengers was lower than the female passengers in any given Pclass.
Find the relationship between features with columns parameter
Using multiple features as indexes is fine, but using some features as columns will help you to intuitively understand the relationship between them. Also, the resultant table can always be better viewed by incorporating the columns parameter of the pivot_table.
This columns parameter is optional and displays the values horizontally on the top of the resultant table.
Both columns and the index parameters are optional, but using them effectively will help you to intuitively understand the relationship between the features.
#columns
table = pd.pivot_table(df,index=['Sex'],columns=['Pclass'],values=['Survived'],aggfunc=np.sum)
table
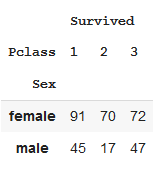
Using Pclass as a column is easier to understand than using it as an index:
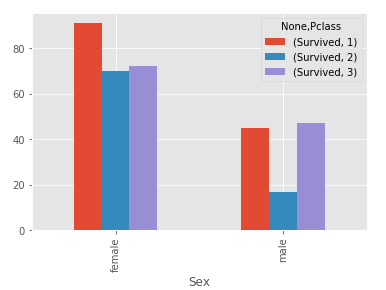
table.plot(kind='bar');
Handling missing data
pivot_table even allows you to deal with the missing values through the parameters dropna and fill_value:
- dropna allows you to drop the null values in the grouped table whose all values are null
- fill_value parameter can be used to replace the NaN values in the grouped table with the values that you provide here
#display null values
table = pd.pivot_table(df,index=['Sex','Survived','Pclass'],columns=['Embarked'],values=['Age'],aggfunc=np.mean)
table

I will be replacing the NaN values with the mean value from the ‘Age’ column:
#handling null values
table = pd.pivot_table(df,index=['Sex','Survived','Pclass'],columns=['Embarked'],values=['Age'],aggfunc=np.mean,fill_value=np.mean(df['Age']))
table

End Notes
In this article, we explored the different parameters of the awesome pivot_table function and how it allows you to easily summarise the features in your dataset through a single line of code.
If you are new to Python programming and want to learn more about data analysis with Python, I highly recommend you explore our free Python for Data Science and Pandas for Data Analysis in Python courses.


This is an extremely valuable and very well presented article. It has really helped me untangle the usage of pivot_table quickly. A very small point, having to do with the analysis, is that in the section "Aggregate on specific features with values parameter" I believe that using 'np.mean' instead of 'np.sum' provides a better perspective on survival rates.
Hi Charles I am so glad to hear that you found the article useful! And thanks for pointing the mistake in the article. The average number of survivors definitely gives a better perspective on survival rates than the number of survivors.
This is really an article very well written in a very comprehensive manner, helped me understand intricacies of pivot table a lot! Had one question regarding it, how to find sum of column values for different level of indexes Let's say in the above example, how to find sum of all female who has survived, and can we represent it in the column itself as a sum row?
Glad you found it useful! If I understand correctly, what you are looking for is the "margins" argument of the Pivot table. I have implemented it in this Gist. Hope it helps.
Excellent article. The layout was clear and concise and the numerous examples really helped me understand what to do in different situations. I have passed this along with my network.
Thanks a lot!
Well written. Clear and concise. Thank you.
Glad to hear that the article helped you!
Hello I think my question was not clear. So rephrasing. So I create a pivot table in python and to_export it to excel. I want that pivot table to behave like excel pivot table. Where you click the counts and it expands in a new excel sheet. I am automating report generation in excel and need to create pivot tables. So I am inputting the raw excel file and create a pivot table using python and export that to excel. I want the output excel with the pivot table to be clickable as if it was created in excel. I searched a lot and couldn't find how it can be done in python. Thanks!
Hi Mou I understand your question, but unfortunately, I couldn't find a solution to it either. I think if you do want that functionality, then you should create the pivot table in Excel itself. However, if you find a solution to your problem, please share it with us and we can all learn at the same time! Thanks Aniruddha