GroupBy in Pandas: Your Guide to Summarizing and Aggregating Data in Python
What if I told you that we can derive effective and impactful insights from our dataset in just a few lines of code?
That’s the beauty of Pandas’ GroupBy function! I have lost count of the number of times I’ve relied on GroupBy to quickly summarize data and aggregate it in a way that’s easy to interpret.
This helps not only when we’re working in a data science project and need quick results, but also in hackathons! When time is of the essence (and when is it not?), the GroupBy function in Pandas saves us a ton of effort by delivering super quick results in a matter of seconds.

Loving GroupBy already? In this article, I will first explain the GroupBy function using an intuitive example before picking up a real-world dataset and implementing GroupBy in Python. Let’s begin aggregating!
If you’re new to the world of Python and Pandas, you’ve come to the right place. Here are two popular free courses you should check out:
Table of Contents
- What is the GroupBy function?
- Understanding the Dataset and the Problem Statement
- First Look at GroupBy
- The Split-Apply-Combine Strategy
- Loop over GroupBy groups
- Applying functions to GroupBy Groups
- Aggregation
- Transformation
- Filteration
- Applying our own function
What is the GroupBy function?
Pandas’ GroupBy is a powerful and versatile function in Python. It allows you to split your data into separate groups to perform computations for better analysis.
Let me take an example to elaborate on this. Let’s say we are trying to analyze the weight of a person in a city. We can easily get a fair idea of their weight by determining the mean weight of all the city dwellers. But here ‘s a question – would the weight be affected by the gender of a person?
We can group the city dwellers into different gender groups and calculate their mean weight. This would give us a better insight into the weight of a person living in the city. But we can probably get an even better picture if we further separate these gender groups into different age groups and then take their mean weight (because a teenage boy’s weight could differ from that of an adult male)!

You can see how separating people into separate groups and then applying a statistical value allows us to make better analysis than just looking at the statistical value of the entire population. This is what makes GroupBy so great!
GroupBy allows us to group our data based on different features and get a more accurate idea about your data. It is a one-stop-shop for deriving deep insights from your data!
Understanding the Dataset and the Problem Statement
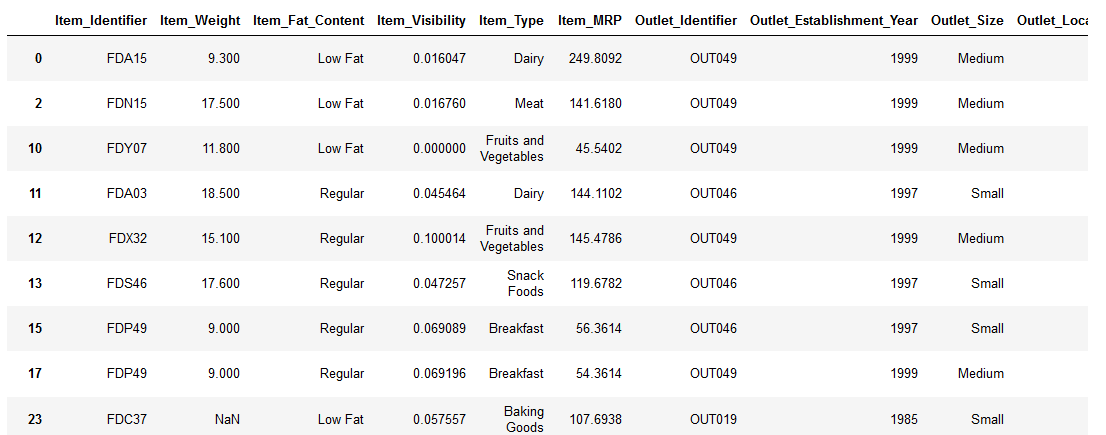
We will be working with the Big Mart Sales dataset from our DataHack platform. It contains attributes related to the products sold at various stores of BigMart. The aim is to find out the sales of each product at a particular store.
Right, let’s import the libraries and explore the data:

We have some missing values in our dataset. These are mostly in the Item_Weight and Outlet_Size. I will handle the missing values for Outlet_Size right now but we’ll handle the missing values for Item_Weight later in the article using the GroupBy function!
First look at GroupBy
Let’s group the dataset based on the outlet location type using GroupBy:
![]()
GroupBy has conveniently returned a DataFrameGroupBy object. It has split the data into separate groups. However, it won’t do anything unless it is being told explicitly to do so. So, let’s find the count of different outlet location types:

We did not tell GroupBy which column we wanted it to apply the aggregation function on, so it applied it to all the relevant columns and returned the output.
But fortunately, GroupBy object supports column indexing just like a DataFrame!
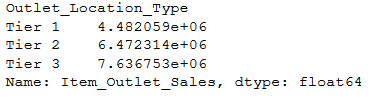
So let’s find out the total sales for each location type:
![]()
Here, GroupBy has returned a SeriesGroupBy object. No computation will be done until we specify the aggregation function:
Awesome! Now, let’s understand the working behind the GroupBy function in Pandas.
The Split-Apply-Combine Strategy
You just saw how quickly you can get an insight into a group of data using the GroupBy function. But, behind the scenes, a lot is taking place which is important to understand to gauge the true power of GroupBy.
GroupBy employs the Split-Apply-Combine strategy coined by Hadley Wickham in his paper in 2011. Using this strategy, a data analyst can break down a big problem into manageable parts, perform operations on individual parts and combine them back together to answer a specific question.
I want to show you how this strategy works in GroupBy by working with a sample dataset to get the average height for males and females in a group. Let’s create that dataset:

Splitting the data into separate groups:
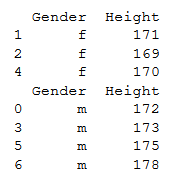
Applying the operation that we need to perform (average in this case):
170.0 174.5
Finally, combining the result to output a DataFrame:

All these three steps can be achieved by using GroupBy with just a single line of code! Here’s how:

Now that is smart! Have a look at how GroupBy did that in the image below:

You can see how GroupBy simplifies our task by doing all the work behind the scenes without us having to worry about a thing!
Now that you understand what the Split-Apply-Combine strategy is, let’s dive deeper into the GroupBy function and unlock its full potential.
Loop over GroupBy Groups
Remember the GroupBy object we created at the beginning of this article? Don’t worry, we’ll create it again:
![]()
We can display the indices in each group by calling the groups on the GroupBy object:

We can even iterate over all of the groups:

But what if you want to get a specific group out of all the groups? Well, don’t worry, Pandas has a solution for that too.
Just provide the specific group name when calling get_group on the group object. Here, I want to check out the features for the ‘Tier 1’ group of locations only:
Now isn’t that wonderful! You have the entire Tier 1 features to work with and derive wonderful insights! But wait, didn’t I say that GroupBy is lazy and doesn’t do anything unless explicitly specified? Alright then, let’s see GroupBy in action with the aggregate functions.
Applying Functions to GroupBy Groups
The apply step is unequivocally the most important step of a GroupBy function where we can perform a variety of operations using aggregation, transformation, filtration or even with your own function!
Let’s have a look at these in detail.
Aggregation
We have looked at some aggregation functions in the article so far, such as mean, mode, and sum. These perform statistical operations on a set of data. Have a glance at all the aggregate functions in the Pandas package:
- count() – Number of non-null observations
- sum() – Sum of values
- mean() – Mean of values
- median() – Arithmetic median of values
- min() – Minimum
- max() – Maximum
- mode() – Mode
- std() – Standard deviation
- var() – Variance
But the agg() function in Pandas gives us the flexibility to perform several statistical computations all at once! Here is how it works:

We can even run GroupBy with multiple indexes to get better insights from our data:

Notice that I have used different aggregation functions for different features by passing them in a dictionary with the corresponding operation to be performed. This allowed me to group and apply computations on nominal and numeric features simultaneously.
Also, I have changed the value of the as_index parameter to False. This way the grouped index would not be output as an index.
We can even rename the aggregated columns to improve their comprehensibility:

It is amazing how a name change can improve the understandability of the output!
Transformation
Transformation allows us to perform some computation on the groups as a whole and then return the combined DataFrame. This is done using the transform() function.
We will try to compute the null values in the Item_Weight column using the transform() function.
The Item_Fat_Content and Item_Type will affect the Item_Weight, don’t you think? So, let’s group the DataFrame by these columns and handle the missing weights using the mean of these groups:
“Using the Transform function, a DataFrame calls a function on itself to produce a DataFrame with transformed values.”
You can read more about the transform() function in this article.
Filtration
Filtration allows us to discard certain values based on computation and return only a subset of the group. We can do this using the filter() function in Pandas.
Let’s take a look at the number of rows in our DataFrame presently:
If I wanted only those groups that have item weights within 3 standard deviations, I could use the filter function to do the job:
(8510, 12)
Applying our own functions
Pandas’ apply() function applies a function along an axis of the DataFrame. When using it with the GroupBy function, we can apply any function to the grouped result.
For example, if I wanted to center the Item_MRP values with the mean of their establishment year group, I could use the apply() function to do just that:

Here, the values have been centered and you can check whether the item was sold at an MRP above or below the mean MRP for that year.
End Notes
I’m sure you can see how amazing the GroupBy function is and how useful it can be for analyzing your data. I hope this article helped you understand the function better!
But practice makes perfect so start with the super impressive datasets on our very own DataHack platform. Moving forward, you can read about how you can analyze your data using a pivot table in Pandas.
Now go and dazzle the world with your amazing data insights!


Thanks for sharing, helpful article for quick reference.
Glad you found it useful!
Well, the sample data used should be provided in the article, That would be a great help and aid in understanding the topic.
Hi Ruff, I have used the Big Mart Sales dataset from the DataHack platform, you can donwload it from there.