40 Questions to test a Data Scientist on Clustering Techniques (Skill test Solution)
Introduction
The idea of creating machines which learn by themselves has been driving humans for decades now. For fulfilling that dream, unsupervised learning and clustering is the key. Unsupervised learning provides more flexibility, but is more challenging as well.
Clustering plays an important role to draw insights from unlabeled data. It classifies the data in similar groups which improves various business decisions by providing a meta understanding.
In this skill test, we tested our community on clustering techniques. A total of 1566 people registered in this skill test.
If you missed taking the test, here is your opportunity for you to find out how many questions you could have answered correctly.
Overall Results
Below is the distribution of scores, this will help you evaluate your performance:
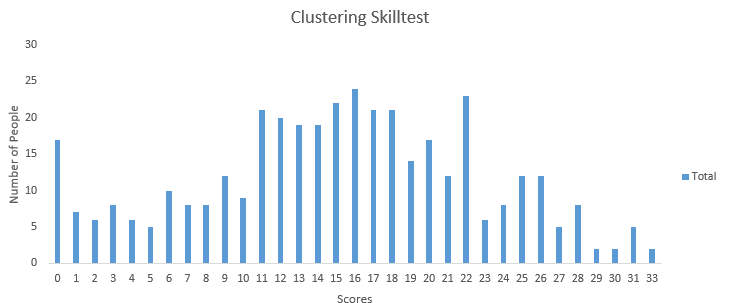
You can access your performance here. More than 390 people participated in the skill test and the highest score was 33. Here are a few statistics about the distribution.
Overall distribution
Mean Score: 15.11
Median Score: 15
Mode Score: 16
Helpful Resources
An Introduction to Clustering and different methods of clustering
Getting your clustering right (Part I)
Getting your clustering right (Part II)
Questions & Answers
Q1. Movie Recommendation systems are an example of:
- Classification
- Clustering
- Reinforcement Learning
- Regression
Options:
B. A. 2 Only
C. 1 and 2
D. 1 and 3
E. 2 and 3
F. 1, 2 and 3
H. 1, 2, 3 and 4
Solution: (E)
Generally, movie recommendation systems cluster the users in a finite number of similar groups based on their previous activities and profile. Then, at a fundamental level, people in the same cluster are made similar recommendations.
In some scenarios, this can also be approached as a classification problem for assigning the most appropriate movie class to the user of a specific group of users. Also, a movie recommendation system can be viewed as a reinforcement learning problem where it learns by its previous recommendations and improves the future recommendations.
Q2. Sentiment Analysis is an example of:
- Regression
- Classification
- Clustering
- Reinforcement Learning
Options:
A. 1 Only
B. 1 and 2
C. 1 and 3
D. 1, 2 and 3
E. 1, 2 and 4
F. 1, 2, 3 and 4
Solution: (E)
Sentiment analysis at the fundamental level is the task of classifying the sentiments represented in an image, text or speech into a set of defined sentiment classes like happy, sad, excited, positive, negative, etc. It can also be viewed as a regression problem for assigning a sentiment score of say 1 to 10 for a corresponding image, text or speech.
Another way of looking at sentiment analysis is to consider it using a reinforcement learning perspective where the algorithm constantly learns from the accuracy of past sentiment analysis performed to improve the future performance.
Q3. Can decision trees be used for performing clustering?
A. True
B. False
Solution: (A)
Decision trees can also be used to for clusters in the data but clustering often generates natural clusters and is not dependent on any objective function.
Q4. Which of the following is the most appropriate strategy for data cleaning before performing clustering analysis, given less than desirable number of data points:
- Capping and flouring of variables
- Removal of outliers
Options:
A. 1 only
B. 2 only
C. 1 and 2
D. None of the above
Solution: (A)
Removal of outliers is not recommended if the data points are few in number. In this scenario, capping and flouring of variables is the most appropriate strategy.
Q5. What is the minimum no. of variables/ features required to perform clustering?
A. 0
B. 1
C. 2
D. 3
Solution: (B)
At least a single variable is required to perform clustering analysis. Clustering analysis with a single variable can be visualized with the help of a histogram.
Q6. For two runs of K-Mean clustering is it expected to get same clustering results?
A. Yes
B. No
Solution: (B)
K-Means clustering algorithm instead converses on local minima which might also correspond to the global minima in some cases but not always. Therefore, it’s advised to run the K-Means algorithm multiple times before drawing inferences about the clusters.
However, note that it’s possible to receive same clustering results from K-means by setting the same seed value for each run. But that is done by simply making the algorithm choose the set of same random no. for each run.
Q7. Is it possible that Assignment of observations to clusters does not change between successive iterations in K-Means
A. Yes
B. No
C. Can’t say
D. None of these
Solution: (A)
When the K-Means algorithm has reached the local or global minima, it will not alter the assignment of data points to clusters for two successive iterations.
Q8. Which of the following can act as possible termination conditions in K-Means?
- For a fixed number of iterations.
- Assignment of observations to clusters does not change between iterations. Except for cases with a bad local minimum.
- Centroids do not change between successive iterations.
- Terminate when RSS falls below a threshold.
Options:
A. 1, 3 and 4
B. 1, 2 and 3
C. 1, 2 and 4
D. All of the above
Solution: (D)
All four conditions can be used as possible termination condition in K-Means clustering:
- This condition limits the runtime of the clustering algorithm, but in some cases the quality of the clustering will be poor because of an insufficient number of iterations.
- Except for cases with a bad local minimum, this produces a good clustering, but runtimes may be unacceptably long.
- This also ensures that the algorithm has converged at the minima.
- Terminate when RSS falls below a threshold. This criterion ensures that the clustering is of a desired quality after termination. Practically, it’s a good practice to combine it with a bound on the number of iterations to guarantee termination.
Q9. Which of the following clustering algorithms suffers from the problem of convergence at local optima?
- K- Means clustering algorithm
- Agglomerative clustering algorithm
- Expectation-Maximization clustering algorithm
- Diverse clustering algorithm
Options:
A. 1 only
B. 2 and 3
C. 2 and 4
D. 1 and 3
E. 1,2 and 4
F. All of the above
Solution: (D)
Out of the options given, only K-Means clustering algorithm and EM clustering algorithm has the drawback of converging at local minima.
Q10. Which of the following algorithm is most sensitive to outliers?
A. K-means clustering algorithm
B. K-medians clustering algorithm
C. K-modes clustering algorithm
D. K-medoids clustering algorithm
Solution: (A)
Out of all the options, K-Means clustering algorithm is most sensitive to outliers as it uses the mean of cluster data points to find the cluster center.
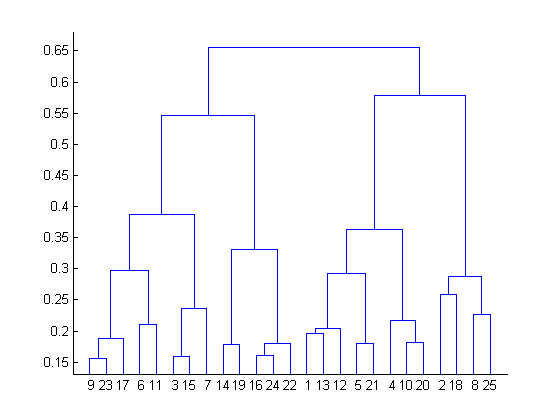
Q11. After performing K-Means Clustering analysis on a dataset, you observed the following dendrogram. Which of the following conclusion can be drawn from the dendrogram?
A. There were 28 data points in clustering analysis
B. The best no. of clusters for the analyzed data points is 4
C. The proximity function used is Average-link clustering
D. The above dendrogram interpretation is not possible for K-Means clustering analysis
Solution: (D)
A dendrogram is not possible for K-Means clustering analysis. However, one can create a cluster gram based on K-Means clustering analysis.
Q12. How can Clustering (Unsupervised Learning) be used to improve the accuracy of Linear Regression model (Supervised Learning):
- Creating different models for different cluster groups.
- Creating an input feature for cluster ids as an ordinal variable.
- Creating an input feature for cluster centroids as a continuous variable.
- Creating an input feature for cluster size as a continuous variable.
Options:
A. 1 only
B. 1 and 2
C. 1 and 4
D. 3 only
E. 2 and 4
F. All of the above
Solution: (F)
Creating an input feature for cluster ids as ordinal variable or creating an input feature for cluster centroids as a continuous variable might not convey any relevant information to the regression model for multidimensional data. But for clustering in a single dimension, all of the given methods are expected to convey meaningful information to the regression model. For example, to cluster people in two groups based on their hair length, storing clustering ID as ordinal variable and cluster centroids as continuous variables will convey meaningful information.
Q13. What could be the possible reason(s) for producing two different dendrograms using agglomerative clustering algorithm for the same dataset?
A. Proximity function used
B. of data points used
C. of variables used
D. B and c only
E. All of the above
Solution: (E)
Change in either of Proximity function, no. of data points or no. of variables will lead to different clustering results and hence different dendrograms.
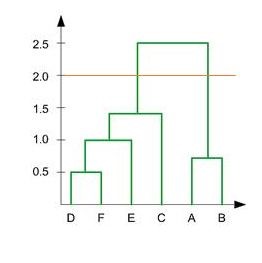
Q14. In the figure below, if you draw a horizontal line on y-axis for y=2. What will be the number of clusters formed?
A. 1
B. 2
C. 3
D. 4
Solution: (B)
Since the number of vertical lines intersecting the red horizontal line at y=2 in the dendrogram are 2, therefore, two clusters will be formed.
Q15. What is the most appropriate no. of clusters for the data points represented by the following dendrogram:

A. 2
B. 4
C. 6
D. 8
Solution: (B)
The decision of the no. of clusters that can best depict different groups can be chosen by observing the dendrogram. The best choice of the no. of clusters is the no. of vertical lines in the dendrogram cut by a horizontal line that can transverse the maximum distance vertically without intersecting a cluster.
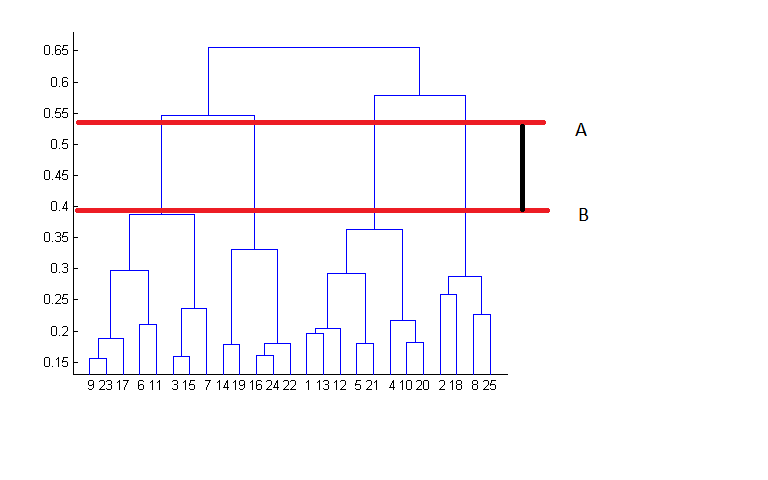
In the above example, the best choice of no. of clusters will be 4 as the red horizontal line in the dendrogram below covers maximum vertical distance AB.
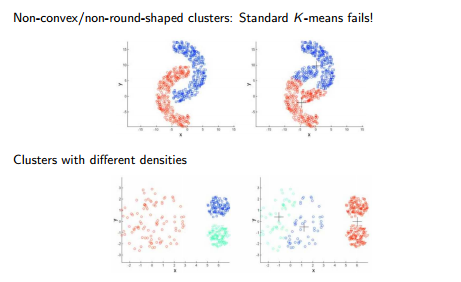
Q16. In which of the following cases will K-Means clustering fail to give good results?
- Data points with outliers
- Data points with different densities
- Data points with round shapes
- Data points with non-convex shapes
Options:
A. 1 and 2
B. 2 and 3
C. 2 and 4
D. 1, 2 and 4
E. 1, 2, 3 and 4
Solution: (D)
K-Means clustering algorithm fails to give good results when the data contains outliers, the density spread of data points across the data space is different and the data points follow non-convex shapes.
Q17. Which of the following metrics, do we have for finding dissimilarity between two clusters in hierarchical clustering?
- Single-link
- Complete-link
- Average-link
Options:
A. 1 and 2
B. 1 and 3
C. 2 and 3
D. 1, 2 and 3
Solution: (D)
All of the three methods i.e. single link, complete link and average link can be used for finding dissimilarity between two clusters in hierarchical clustering.
Q18. Which of the following are true?
- Clustering analysis is negatively affected by multicollinearity of features
- Clustering analysis is negatively affected by heteroscedasticity
Options:
A. 1 only
B. 2 only
C. 1 and 2
D. None of them
Solution: (A)
Clustering analysis is not negatively affected by heteroscedasticity but the results are negatively impacted by multicollinearity of features/ variables used in clustering as the correlated feature/ variable will carry extra weight on the distance calculation than desired.
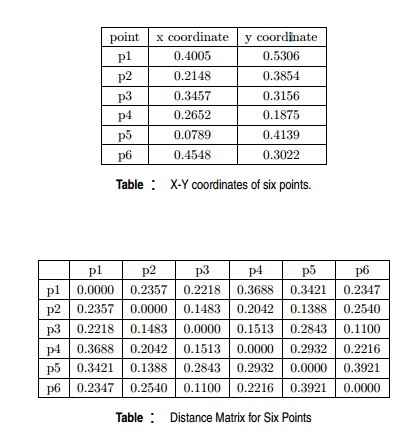
Q19. Given, six points with the following attributes:

Which of the following clustering representations and dendrogram depicts the use of MIN or Single link proximity function in hierarchical clustering:
A. 
B. 
C. 
D. 
Solution: (A)
For the single link or MIN version of hierarchical clustering, the proximity of two clusters is defined to be the minimum of the distance between any two points in the different clusters. For instance, from the table, we see that the distance between points 3 and 6 is 0.11, and that is the height at which they are joined into one cluster in the dendrogram. As another example, the distance between clusters {3, 6} and {2, 5} is given by dist({3, 6}, {2, 5}) = min(dist(3, 2), dist(6, 2), dist(3, 5), dist(6, 5)) = min(0.1483, 0.2540, 0.2843, 0.3921) = 0.1483.
Q20 Given, six points with the following attributes:

Which of the following clustering representations and dendrogram depicts the use of MAX or Complete link proximity function in hierarchical clustering:
A. 
B. 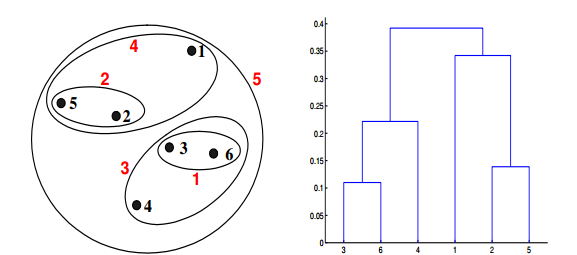
C. 
D. 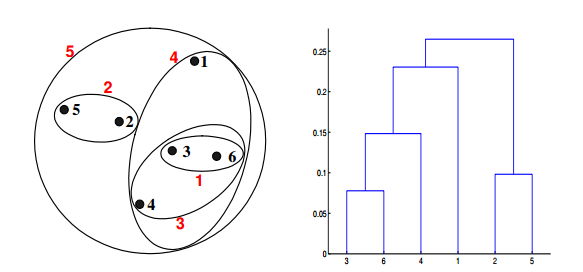
Solution: (B)
For the single link or MAX version of hierarchical clustering, the proximity of two clusters is defined to be the maximum of the distance between any two points in the different clusters. Similarly, here points 3 and 6 are merged first. However, {3, 6} is merged with {4}, instead of {2, 5}. This is because the dist({3, 6}, {4}) = max(dist(3, 4), dist(6, 4)) = max(0.1513, 0.2216) = 0.2216, which is smaller than dist({3, 6}, {2, 5}) = max(dist(3, 2), dist(6, 2), dist(3, 5), dist(6, 5)) = max(0.1483, 0.2540, 0.2843, 0.3921) = 0.3921 and dist({3, 6}, {1}) = max(dist(3, 1), dist(6, 1)) = max(0.2218, 0.2347) = 0.2347.
Q21 Given, six points with the following attributes:
Which of the following clustering representations and dendrogram depicts the use of Group average proximity function in hierarchical clustering:
A. 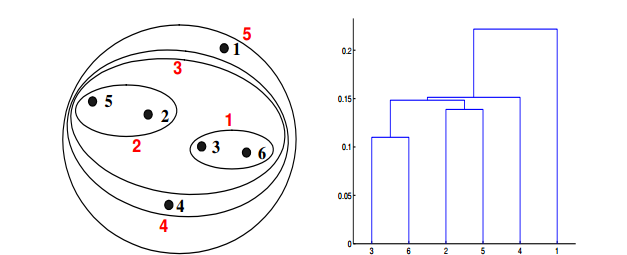
B. 
C. 
D. 
Solution: (C)
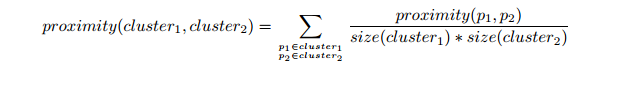
For the group average version of hierarchical clustering, the proximity of two clusters is defined to be the average of the pairwise proximities between all pairs of points in the different clusters. This is an intermediate approach between MIN and MAX. This is expressed by the following equation:
Here, the distance between some clusters. dist({3, 6, 4}, {1}) = (0.2218 + 0.3688 + 0.2347)/(3 ∗ 1) = 0.2751. dist({2, 5}, {1}) = (0.2357 + 0.3421)/(2 ∗ 1) = 0.2889. dist({3, 6, 4}, {2, 5}) = (0.1483 + 0.2843 + 0.2540 + 0.3921 + 0.2042 + 0.2932)/(6∗1) = 0.2637. Because dist({3, 6, 4}, {2, 5}) is smaller than dist({3, 6, 4}, {1}) and dist({2, 5}, {1}), these two clusters are merged at the fourth stage
Q22. Given, six points with the following attributes:

Which of the following clustering representations and dendrogram depicts the use of Ward’s method proximity function in hierarchical clustering:
A. 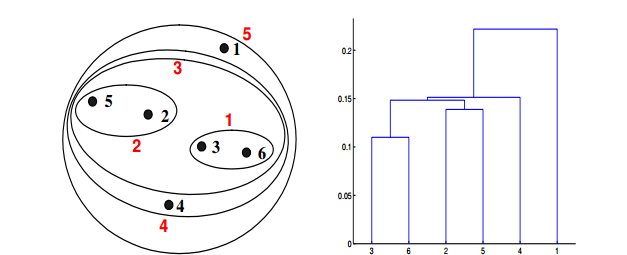
B. 
C. 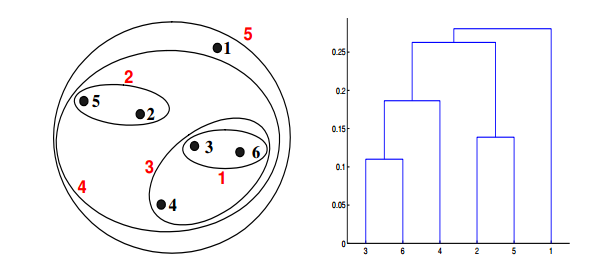
D. 
Solution: (D)
Ward method is a centroid method. Centroid method calculates the proximity between two clusters by calculating the distance between the centroids of clusters. For Ward’s method, the proximity between two clusters is defined as the increase in the squared error that results when two clusters are merged. The results of applying Ward’s method to the sample data set of six points. The resulting clustering is somewhat different from those produced by MIN, MAX, and group average.
Q23. What should be the best choice of no. of clusters based on the following results:
A. 1
B. 2
C. 3
D. 4
Solution: (C)
The silhouette coefficient is a measure of how similar an object is to its own cluster compared to other clusters. Number of clusters for which silhouette coefficient is highest represents the best choice of the number of clusters.
Q24. Which of the following is/are valid iterative strategy for treating missing values before clustering analysis?
A. Imputation with mean
B. Nearest Neighbor assignment
C. Imputation with Expectation Maximization algorithm
D. All of the above
Solution: (C)
All of the mentioned techniques are valid for treating missing values before clustering analysis but only imputation with EM algorithm is iterative in its functioning.
Q25. K-Mean algorithm has some limitations. One of the limitation it has is, it makes hard assignments(A point either completely belongs to a cluster or not belongs at all) of points to clusters.
Note: Soft assignment can be consider as the probability of being assigned to each cluster: say K = 3 and for some point xn, p1 = 0.7, p2 = 0.2, p3 = 0.1)
Which of the following algorithm(s) allows soft assignments?
- Gaussian mixture models
- Fuzzy K-means
Options:
A. 1 only
B. 2 only
C. 1 and 2
D. None of these
Solution: (C)
Both, Gaussian mixture models and Fuzzy K-means allows soft assignments.
Q26. Assume, you want to cluster 7 observations into 3 clusters using K-Means clustering algorithm. After first iteration clusters, C1, C2, C3 has following observations:
C1: {(2,2), (4,4), (6,6)}
C2: {(0,4), (4,0)}
C3: {(5,5), (9,9)}
What will be the cluster centroids if you want to proceed for second iteration?
A. C1: (4,4), C2: (2,2), C3: (7,7)
B. C1: (6,6), C2: (4,4), C3: (9,9)
C. C1: (2,2), C2: (0,0), C3: (5,5)
D. None of these
Solution: (A)
Finding centroid for data points in cluster C1 = ((2+4+6)/3, (2+4+6)/3) = (4, 4)
Finding centroid for data points in cluster C2 = ((0+4)/2, (4+0)/2) = (2, 2)
Finding centroid for data points in cluster C3 = ((5+9)/2, (5+9)/2) = (7, 7)
Hence, C1: (4,4), C2: (2,2), C3: (7,7)
Q27. Assume, you want to cluster 7 observations into 3 clusters using K-Means clustering algorithm. After first iteration clusters, C1, C2, C3 has following observations:
C1: {(2,2), (4,4), (6,6)}
C2: {(0,4), (4,0)}
C3: {(5,5), (9,9)}
What will be the Manhattan distance for observation (9, 9) from cluster centroid C1. In second iteration.
A. 10
B. 5*sqrt(2)
C. 13*sqrt(2)
D. None of these
Solution: (A)
Manhattan distance between centroid C1 i.e. (4, 4) and (9, 9) = (9-4) + (9-4) = 10
Q28. If two variables V1 and V2, are used for clustering. Which of the following are true for K means clustering with k =3?
- If V1 and V2 has a correlation of 1, the cluster centroids will be in a straight line
- If V1 and V2 has a correlation of 0, the cluster centroids will be in straight line
Options:
A. 1 only
B. 2 only
C. 1 and 2
D. None of the above
Solution: (A)
If the correlation between the variables V1 and V2 is 1, then all the data points will be in a straight line. Hence, all the three cluster centroids will form a straight line as well.
Q29. Feature scaling is an important step before applying K-Mean algorithm. What is reason behind this?
A. In distance calculation it will give the same weights for all features
B. You always get the same clusters. If you use or don’t use feature scaling
C. In Manhattan distance it is an important step but in Euclidian it is not
D. None of these
Solution; (A)
Feature scaling ensures that all the features get same weight in the clustering analysis. Consider a scenario of clustering people based on their weights (in KG) with range 55-110 and height (in inches) with range 5.6 to 6.4. In this case, the clusters produced without scaling can be very misleading as the range of weight is much higher than that of height. Therefore, its necessary to bring them to same scale so that they have equal weightage on the clustering result.
Q30. Which of the following method is used for finding optimal of cluster in K-Mean algorithm?
A. Elbow method
B. Manhattan method
C. Ecludian mehthod
D. All of the above
E. None of these
Solution: (A)
Out of the given options, only elbow method is used for finding the optimal number of clusters. The elbow method looks at the percentage of variance explained as a function of the number of clusters: One should choose a number of clusters so that adding another cluster doesn’t give much better modeling of the data.
Q31. What is true about K-Mean Clustering?
- K-means is extremely sensitive to cluster center initializations
- Bad initialization can lead to Poor convergence speed
- Bad initialization can lead to bad overall clustering
Options:
A. 1 and 3
B. 1 and 2
C. 2 and 3
D. 1, 2 and 3
Solution: (D)
All three of the given statements are true. K-means is extremely sensitive to cluster center initialization. Also, bad initialization can lead to Poor convergence speed as well as bad overall clustering.
Q32. Which of the following can be applied to get good results for K-means algorithm corresponding to global minima?
- Try to run algorithm for different centroid initialization
- Adjust number of iterations
- Find out the optimal number of clusters
Options:
A. 2 and 3
B. 1 and 3
C. 1 and 2
D. All of above
Solution: (D)
All of these are standard practices that are used in order to obtain good clustering results.
Q33. What should be the best choice for number of clusters based on the following results:
A. 5
B. 6
C. 14
D. Greater than 14
Solution: (B)
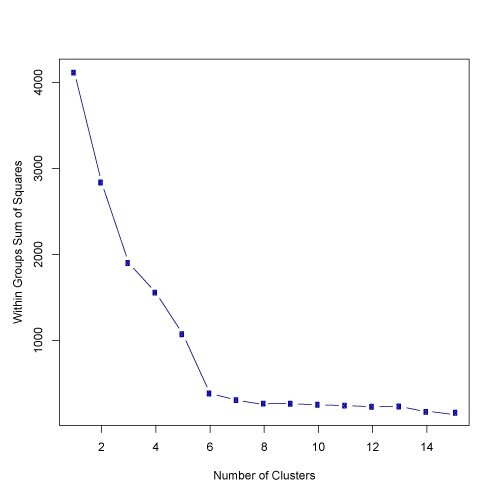
Based on the above results, the best choice of number of clusters using elbow method is 6.
Q34. What should be the best choice for number of clusters based on the following results:

A. 2
B. 4
C. 6
D. 8
Solution: (C)
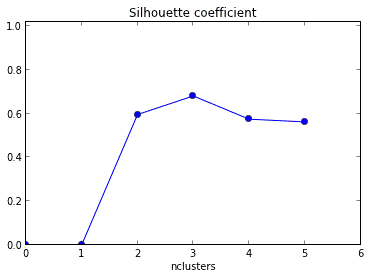
Generally, a higher average silhouette coefficient indicates better clustering quality. In this plot, the optimal clustering number of grid cells in the study area should be 2, at which the value of the average silhouette coefficient is highest. However, the SSE of this clustering solution (k = 2) is too large. At k = 6, the SSE is much lower. In addition, the value of the average silhouette coefficient at k = 6 is also very high, which is just lower than k = 2. Thus, the best choice is k = 6.
Q35. Which of the following sequences is correct for a K-Means algorithm using Forgy method of initialization?
- Specify the number of clusters
- Assign cluster centroids randomly
- Assign each data point to the nearest cluster centroid
- Re-assign each point to nearest cluster centroids
- Re-compute cluster centroids
Options:
A. 1, 2, 3, 5, 4
B. 1, 3, 2, 4, 5
C. 2, 1, 3, 4, 5
D. None of these
Solution: (A)
The methods used for initialization in K means are Forgy and Random Partition. The Forgy method randomly chooses k observations from the data set and uses these as the initial means. The Random Partition method first randomly assigns a cluster to each observation and then proceeds to the update step, thus computing the initial mean to be the centroid of the cluster’s randomly assigned points.
Q36. If you are using Multinomial mixture models with the expectation-maximization algorithm for clustering a set of data points into two clusters, which of the assumptions are important:
A. All the data points follow two Gaussian distribution
B. All the data points follow n Gaussian distribution (n >2)
C. All the data points follow two multinomial distribution
D. All the data points follow n multinomial distribution (n >2)
Solution: (C)
In EM algorithm for clustering its essential to choose the same no. of clusters to classify the data points into as the no. of different distributions they are expected to be generated from and also the distributions must be of the same type.
Q37. Which of the following is/are not true about Centroid based K-Means clustering algorithm and Distribution based expectation-maximization clustering algorithm:
- Both starts with random initializations
- Both are iterative algorithms
- Both have strong assumptions that the data points must fulfill
- Both are sensitive to outliers
- Expectation maximization algorithm is a special case of K-Means
- Both requires prior knowledge of the no. of desired clusters
- The results produced by both are non-reproducible.
Options:
A. 1 only
B. 5 only
C. 1 and 3
D. 6 and 7
E. 4, 6 and 7
F. None of the above
Solution: (B)
All of the above statements are true except the 5th as instead K-Means is a special case of EM algorithm in which only the centroids of the cluster distributions are calculated at each iteration.
Q38. Which of the following is/are not true about DBSCAN clustering algorithm:
- For data points to be in a cluster, they must be in a distance threshold to a core point
- It has strong assumptions for the distribution of data points in dataspace
- It has substantially high time complexity of order O(n3)
- It does not require prior knowledge of the no. of desired clusters
- It is robust to outliers
Options:
A. 1 only
B. 2 only
C. 4 only
D. 2 and 3
E. 1 and 5
F. 1, 3 and 5
Solution: (D)
- DBSCAN can form a cluster of any arbitrary shape and does not have strong assumptions for the distribution of data points in the dataspace.
- DBSCAN has a low time complexity of order O(n log n) only.
Q39. Which of the following are the high and low bounds for the existence of F-Score?
A. [0,1]
B. (0,1)
C. [-1,1]
D. None of the above
Solution: (A)
The lowest and highest possible values of F score are 0 and 1 with 1 representing that every data point is assigned to the correct cluster and 0 representing that the precession and/ or recall of the clustering analysis are both 0. In clustering analysis, high value of F score is desired.
Q40. Following are the results observed for clustering 6000 data points into 3 clusters: A, B and C:
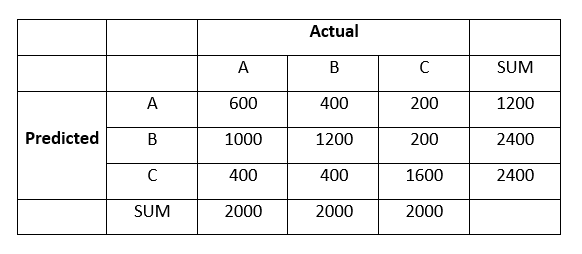
What is the F1-Score with respect to cluster B?
A. 3
B. 4
C. 5
D. 6
Solution: (D)
Here,
True Positive, TP = 1200
True Negative, TN = 600 + 1600 = 2200
False Positive, FP = 1000 + 200 = 1200
False Negative, FN = 400 + 400 = 800
Therefore,
Precision = TP / (TP + FP) = 0.5
Recall = TP / (TP + FN) = 0.6
Hence,
F1 = 2 * (Precision * Recall)/ (Precision + recall) = 0.54 ~ 0.5
End Notes
I hope you enjoyed taking the test and found the solutions helpful. The test focused on conceptual as well as practical knowledge of clustering fundamentals and its various techniques.
I tried to clear all your doubts through this article, but if we have missed out on something then let us know in comments below. Also, If you have any suggestions or improvements you think we should make in the next skilltest, you can let us know by dropping your feedback in the comments section.


I am confused with question 40. It says the correct answer in D(6) and solution shows C(5). Anyway, rounding of 5.4 to 5 is not very clean.
Hi Eudie, Well, 5.4 is rounded off to 5 not 6 and 5.5 is rounded off to 6 not 5. This is standard convention. I'll make sure to explicitly mention it next time to avoid any confusion that you might have had. Best, Saurav.
Thanks for the test. Appreciate it. One feedback : Please classify what is good /bad score according to difficulty level of test.
Hi Arihant, Well, the average score is 15. You can simply use the score statistics to find your percentile and know where you stand compared to all. Personally speaking, 12 or more is a decent enough score. Best, Saurav.
This blog giving the details of technology. This gives the details about working with the business processes and change the way. Here explains think different and work different then provide the better output. Thanks for this blog.
Hi Lithika, Thank you for your kind words. We at Analytics Vidhya really appreciate your gratitude. Best, Saurav.
your questions are really super so that i can get your knowledgeable questions, so that it will be helpful and i am looking forward more things.
Hi Deepika, Sure, Big things to come. Stay tuned!
Superb i really enjoyed very much with this article here. Really its a amazing article i had ever read. I hope it will help a lot for all. Thank you so much for this amazing posts and please keep update like this excellent article.
Hi Jeslin, Glad you found it helpful. Definitely, stay tuned. Best, Saurav.
Thank you the solutions, Great article. The skills test is a great way to test our skills. Looking forward to more such skills tests and articles.
Hi Kriti, Glad you liked it. A lot of big things to come. Stay tuned. Best, Saurav.
Hello Saurav , I have a query unrelated to the above post , hope you wouldn't mind me posting here . I want to know what difference does it makes if a person goes for MTech and works in machine learning and other goes for self learning ? How the two approaches differ and in industry what would be the work profile of both ? I hope you will answer the query or direct me to required place for the question .
Hi Geetika, To reach out to the AV community to answer this question, you should post your query here: https://discuss.analyticsvidhya.com/ Best, Saurav.
K-Mean algorithm has some limitations. I have see that to some yes the K Mean Algorithm does make it to some pretty hard for certain aspects that use its system, The skills test is always great to test where you are at do you have more content as this with more big things coming soon ?
Hi Jake, Yes, there are a lot of big things coming up. You can stay tuned to these events here: https://datahack.analyticsvidhya.com/contest/all/ . Best, Saurav.