Introduction
The natural progression of learning statistics typically begins with measures of central tendency and then moves on to correlation, regression, and other advanced concepts. While initially found correlation relatively easy to grasp, I encountered challenges when it became intertwined with other statistical concepts and metrics like causation, regression, distribution, and the Pearson correlation coefficient. It took some time and effort to fully understand this concept, particularly in the context of real-world datasets.
If you’re still struggling to differentiate between correlation and causation, refer to my previous article where I explained these concepts in a simple manner.
Moving forward, let’s delve into some of the most commonly asked questions on correlation. These questions are often encountered in statistical learning journeys, and facing them head-on can serve as a valuable refresher, especially when exploring topics like hypothesis testing and its relationship to correlation analysis.
For those preparing for data science interviews, I highly recommend checking out the ‘Ace Data Science Interviews’ course. With its extensive collection of videos and hundreds of practice questions, it’s an excellent resource to ensure you’re well-prepared for your next data analysis or data science interview.

Let’s look at 11 most commonly asked questions on Correlation!
Q1. What is the mathematical formula to derive the Pearson Coefficient?
The most widely used correlation coefficient is Pearson Coefficient. Here is the mathematical formula to derive Pearson Coefficient.

Explanation: It simply is the ratio of co-variance of two variables to a product of variance (of the variables). It takes a value between +1 and -1. An extreme value on both the side means they are strongly correlated with each other. A value of zero indicates a NIL correlation but not a non-dependence. You’ll understand this clearly in one of the following answers.
Q2. What is the difference between Correlation and Dependency?
A non-dependency between two variable means a zero correlation. However the inverse is not true. A zero correlation can even have a perfect dependency. Here is an example:

In this scenario, where the square of x is linearly dependent on y (the dependent variable), everything to the right of y axis is negative correlated and to left is positively correlated. So what will be the Pearson Correlation coefficient?
If you do the math, you will see a zero correlation between these two variables. What does that mean? For a pair of variables which are perfectly dependent on each other, can also give you a zero correlation.
Must remember tip: Correlation quantifies the linear dependence of two variables. It cannot capture non-linear relationship between two variables.
Good Read: Must Read Books in Analytics / Data Science
Q3. Is Correlation Transitive?
Suppose that X, Y, and Z are random variables. X and Y are positively correlated and Y and Z are likewise positively correlated. Does it follow that X and Z must be positively correlated?
As we shall see by example, the answer is (perhaps surprisingly) “No.” We may prove that if the correlations are sufficiently close to 1, then X and Z must be positively correlated.
Let’s assume C(x,y) is the correlation coefficient between x and y. Like wise we have C(x,z) and C(y,z). Here is an equation which comes from solving correlation equation mathematically:
C(x,y) = C(y,z) * C(z,x) - Square Root ( (1 - C(y,z)^2 ) * (1 - C(z,x)^2 ) )Now if we want C(x,y) to be more than zero , we basically want the RHS of above equation to be positive. Hence, you need to solve for :
C(y,z) * C(z,x) > Square Root ( (1 - C(y,z)^2 ) * (1 - C(z,x)^2 ) )We can actually solve the above equation for both C(y,z) > 0 and C(y,z) < 0 together by squaring both sides. This will finally give the result as C(x,y) is a non zero number if following equation holds true:
C(y,z) ^ 2 + C(z,x) ^ 2 > 1Wow, this is an equation for a circle. Hence the following plot will explain everything:

If the two known correlation are in the A zone, the third correlation will be positive. If they lie in the B zone, the third correlation will be negative. Inside the circle, we cannot say anything about the relationship. A very interesting insight here is that even if C(y,z) and C(z,x) are 0.5, C(x,y) can actually also be negative.
Understanding the relationship between variables often involves exploring whether they exhibit positive correlation, where an increase in one variable corresponds with an increase in the other, or negative correlation, where an increase in one variable corresponds with a decrease in the other.
Q4. Is Pearson coefficient sensitive to outliers?
The answer is Yes. Even a single outlier can change the direction of the coefficient. Here are a few cases, all of which have the same correlation coefficient of 0.81:
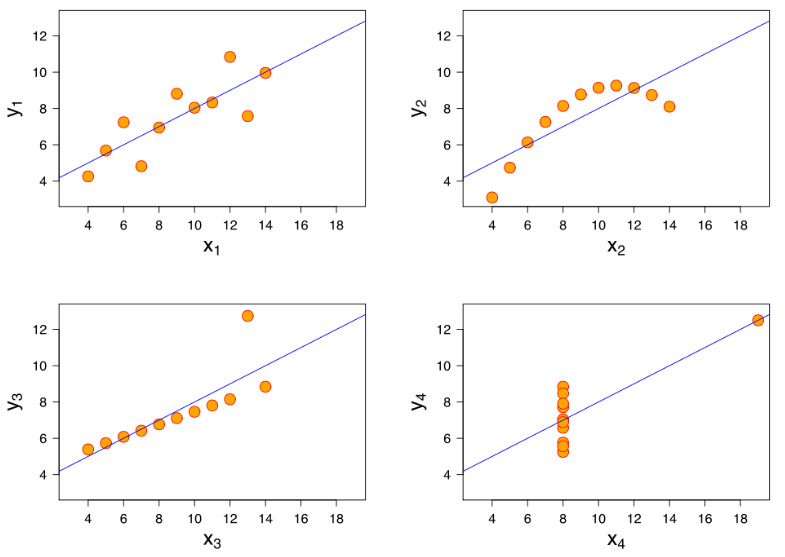
Consider the last two graphs(X 3Y3 and X 4Y4). X3Y3 is clearly a case of perfect correlation where a single outlier brings down the coefficient significantly. The last graph is complete opposite, the correlation coefficient becomes a high positive number because of a single outlier.
Conclusively, this turns out to be the biggest concern with correlation coefficient, it is highly influenced by the outliers. When examining the data through a scatterplot, we can often identify outliers that exert disproportionate influence on correlation coefficients, especially when considering individual data points.
Check your potential: Should I become a Data Scientist?
Q5. Does causation imply correlation?
If you have read our above three answers, I am sure you will be able to answer this one. The answer is No, because causation can also lead to a non-linear relationship. Let’s understand how!
Below is the graph showing density of water from 0 to 12 degree Celsius. We know that density is an effect of changing temperature. But, density can reach its maximum value at 4 degree Celsius. Therefore, it will not be linearly correlated to the temperature. Understanding the distinction between cause and effect is crucial in correlation analysis.

Q6. What is the difference between Correlation and Simple Linear Regression?
These two are really close. So let’s start with a few things which are common for both.
- The square of Pearson’s correlation coefficient is the same as the one in simple linear regression
- Neither simple linear regression nor correlation answer questions of causality directly. This point is important, because I’ve met people thinking that simple regression can magically allow an inference that X causes. That’s preposterous belief.
What’s the difference between correlation and simple linear regression?
Now let’s think of few differences between the two. Simple linear regression gives much more information about the relationship than Pearson Correlation. It models the relationship between variables using a straight line, providing insights into the slope and intercept parameters. Here are a few things which regression will give but correlation coefficient will not.
- The slope in a linear regression gives the marginal change in output/target variable by changing the independent variable by unit distance. Correlation has no slope.
- The intercept in a linear regression gives the value of target variable if one of the input/independent variable is set zero. Correlation does not have this information.
- Linear regression can give you a prediction given all the input variables. Correlation analysis does not predict anything.
Q7. What is the difference between Pearson and Spearman?
The simplest answer here is Pearson captures how linearly dependent are the two variables whereas Spearman captures the monotonic behavior of the relation between the variables.
For instance consider following relationship :
- y = exp ( x )
Here you will find Pearson coefficient to be 0.25 but the Spearman coefficient to be 1. As a thumb rule, you should only begin with Spearman when you have some initial hypothesis of the relation being non-linear. Otherwise, we generally try Pearson first and if that is low, try Spearman. This way you know whether the variables are linearly related or just have a monotonic behavior.
Q8. What is the difference between correlation and co-variance?
If you skipped the mathematical formula of correlation at the start of this article, now is the time to revisit the same.
Correlation is simply the normalized co-variance with the standard deviation of both the factors. This is done to ensure we get number between +1 and -1. Strong correlation, represented by values close to +1 or -1, indicates a tight linear relationship between the variables. Co-variance is very difficult to compare as it depends on the units of the two variable. It might come out to be the case that marks of student is more correlated to his toe nail in mili-meters than it is to his attendance rate.
This is just because of the difference in units of the second variable. Hence, we see a need to normalize this co-variance with some spread to make sure we compare apples with apples. This normalized number is known as the correlation.
Q9. What does a correlation coefficient tell you?
The correlation coefficient measures the strength and direction of the linear relationship between two variables. A positive correlation coefficient indicates a positive relationship, meaning that as one variable increases, the other variable also tends to increase. Conversely, a negative correlation coefficient suggests an inverse relationship, where one variable increases as the other decreases. Understanding these types of correlation is essential for interpreting relationships in data analysis.
Q10. How do you interpret a correlation matrix?
A correlation matrix provides a comprehensive view of the relationships between multiple variables in a dataset. Each cell in the matrix represents the correlation coefficient between two variables. A positive correlation coefficient indicates a positive relationship, while a negative coefficient suggests an inverse relationship. The closer the correlation coefficient is to +1 or -1, the stronger the linear relationship between the variables. However, it’s essential to remember that correlation does not imply causation, and other factors such as confounding variables must be considered in the interpretation.
Q11. What are the limitations of using correlation to infer causation?
While correlation analysis is useful for identifying relationships between variables, it cannot determine causation. Correlation only measures the degree of association between variables and does not account for other factors that may influence the relationship. For example, confounding variables, sample size, and the presence of outliers can affect correlation results. Additionally, correlation analysis assumes that variables follow a linear pattern and are normally distributed, which may not always be the case in real-world data. Therefore, it’s essential to use caution when inferring causation from correlation and to consider other research methodologies, such as regression analysis, to explore causal relationships.
Conclusion
In conclusion, mastering linear correlation analysis involves understanding its intricate relationship with causation and the vice-versa, especially when dealing with real-world datasets. It’s crucial to comprehend the methodology behind correlation analysis, discerning whether variables exhibit a positive or negative relationship. Exploring hypothesis testing and the ordinal nature of data points further enhances one’s grasp of correlation. By distinguishing between cause and effect, we can better interpret correlation results and apply them effectively in various analytical contexts. If you have any more questions on Correlation, we will be happy to answer them on our discussion portal.
Key Takeaways
- It’s essential to understand that correlation measures the strength and direction of the linear relationship between variables but does not imply causation. Other factors must be considered to infer causation accurately.
- The Pearson correlation coefficient is sensitive to outliers; even a single outlier can significantly alter the direction of the coefficient, highlighting the importance of identifying and handling outliers appropriately.
- Zero correlation does not necessarily indicate a lack of dependency between variables; perfect dependency can result in zero correlation. This emphasizes that correlation measures linear dependence and may not capture non-linear relationships.


Tavish, I tried the following in R. I get pearson correlation as 0.88 and not 0.25 as you explained in the post. Please clarify. > x=c(1:5) > y=exp(x) > y [1] 2.718282 7.389056 20.085537 54.598150 148.413159 > cor(x,y,method="pearson") [1] 0.8862751 > cor(x,y,method="spearman") [1] 1
Try with x <- c(1:100) you should get 0.25.
Very informative article! Thank you for writing this. If possible, could you also publish an article giving insights into various kinds of hypothesis testing techniques?
Read this one and "difference between correlation and causation" back to back. My concepts on corelation have been solidified. Thanks for writing such informative articles.